import matplotlib.pyplot as plt
import numpy as np
from collections import Counter
from wordcloud import WordCloud, STOPWORDSWordcloud Plot (Python)
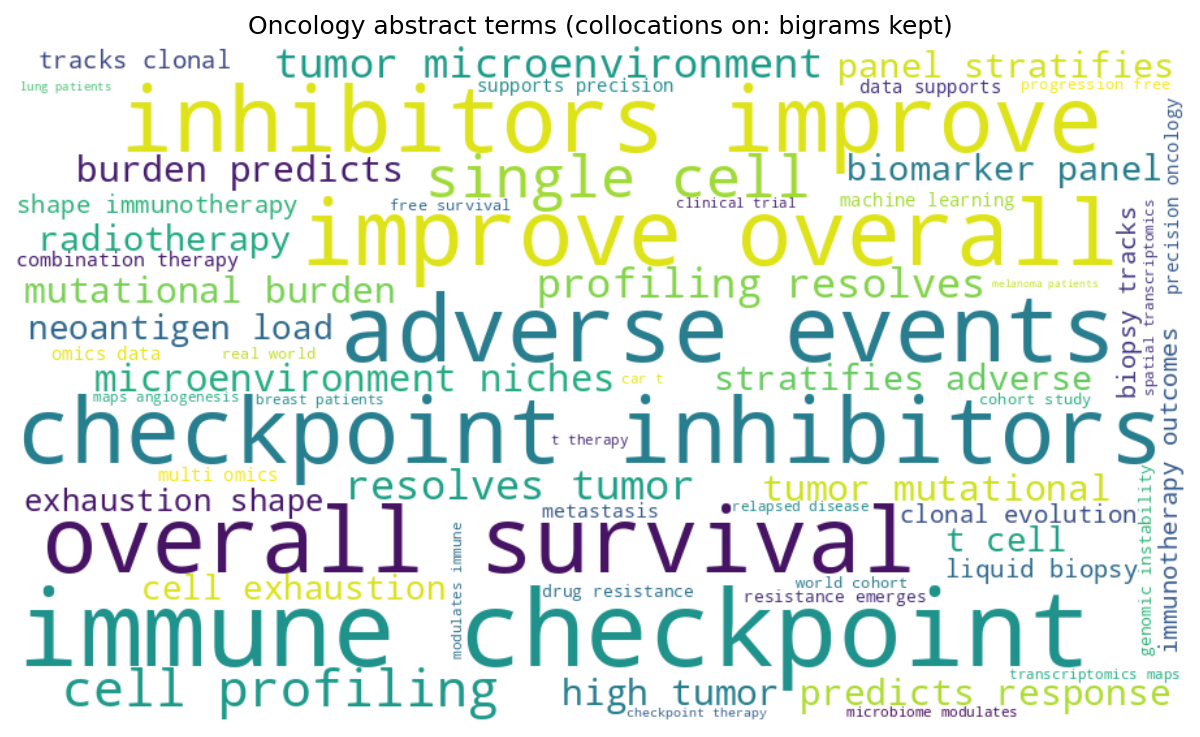
The Python counterpart of Wordcloud — a wordcloud sizes terms by frequency, giving an instant overview of the vocabulary of a corpus: research topics in a conference program, patient-reported symptoms in a survey, or indexing terms across a PubMed query. It is an exploratory display, not a measurement — precise comparison belongs in a frequency table or bar chart.
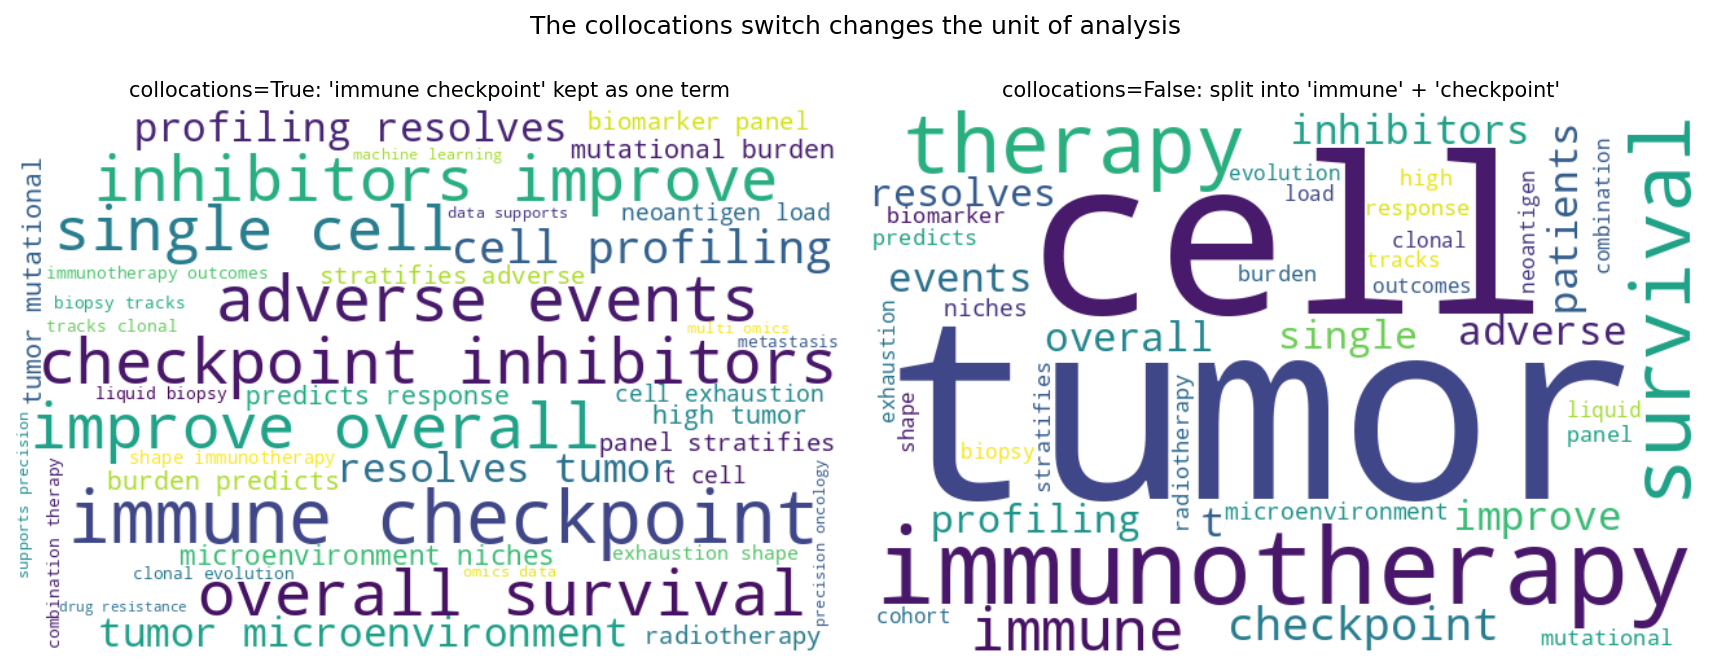
The wordcloud package builds the layout [1]. Two settings dominate the result: collocations (whether adjacent word pairs like “immune checkpoint” are kept as one term) and the input mode (free text vs a precomputed frequency dictionary). Both change the unit of analysis, so they must be stated in the caption.
This tutorial covers two workflows:
- A text-driven cloud with collocations (bigrams) kept;
- A frequency-driven cloud with a print-friendly sequential palette.
Example
Setup
- System Requirements: Cross-platform (Linux/MacOS/Windows)
- Programming Language: Python
- Dependencies:
matplotlib,numpy,wordcloud
Data Preparation
We assemble a pseudo-corpus of oncology abstract sentences, sampled 600 times with fixed weights so the topic distribution is reproducible. Token frequencies are also counted directly (minus stopwords) for the frequency-driven variant. For Chinese text, tokenize with jieba first and pass the token list or frequency dictionary — wordcloud splits on whitespace otherwise.
rng = np.random.default_rng(13)
templates = [
    "immune checkpoint inhibitors improve overall survival in {d} patients",
    "high tumor mutational burden predicts response to immunotherapy",
    "single-cell profiling resolves tumor microenvironment niches",
    "liquid biopsy tracks clonal evolution during combination therapy",
    "a biomarker panel stratifies adverse events after radiotherapy",
    "neoantigen load and t cell exhaustion shape immunotherapy outcomes",
    "spatial transcriptomics maps angiogenesis in metastasis",
    "machine learning on multi-omics data supports precision oncology",
    "drug resistance emerges through genomic instability",
    "a real world cohort study of progression-free survival",
    "the microbiome modulates immune checkpoint therapy",
    "car-t therapy in relapsed disease: a clinical trial",
    "chronic inflammation accelerates tumor growth and metastasis",
    "quality of life and adverse events in elderly cohorts",
    "pathology review confirmed tumor suppressor loss",
]
weights = np.array([8, 7, 7, 6, 6, 5, 4, 5, 4, 4, 3, 3, 3, 2, 2], float)
picks = rng.choice(len(templates), size=600, p=weights / weights.sum())
text = " ".join(
    templates[i].format(d=rng.choice(["melanoma", "lung", "breast"]))
    for i in picks)

terms = Counter()
for i in picks:
    for tok in templates[i].replace("{d}", "patients").split():
        if tok.lower() not in STOPWORDS and tok.isalpha():
            terms[tok.lower()] += 1
freq = dict(terms)
Visualization
1. Text-Driven Cloud with Collocations
wc = WordCloud(width=900, height=520, background_color="white",
               colormap="viridis", stopwords=STOPWORDS,
               collocations=True, random_state=7, max_words=60)
wc = wc.generate_from_text(text)
fig, ax = plt.subplots(figsize=(8.5, 5))
ax.imshow(wc, interpolation="bilinear")
ax.axis("off")
ax.set_title("Oncology abstract terms (collocations on: bigrams kept)")
fig.tight_layout()
plt.show()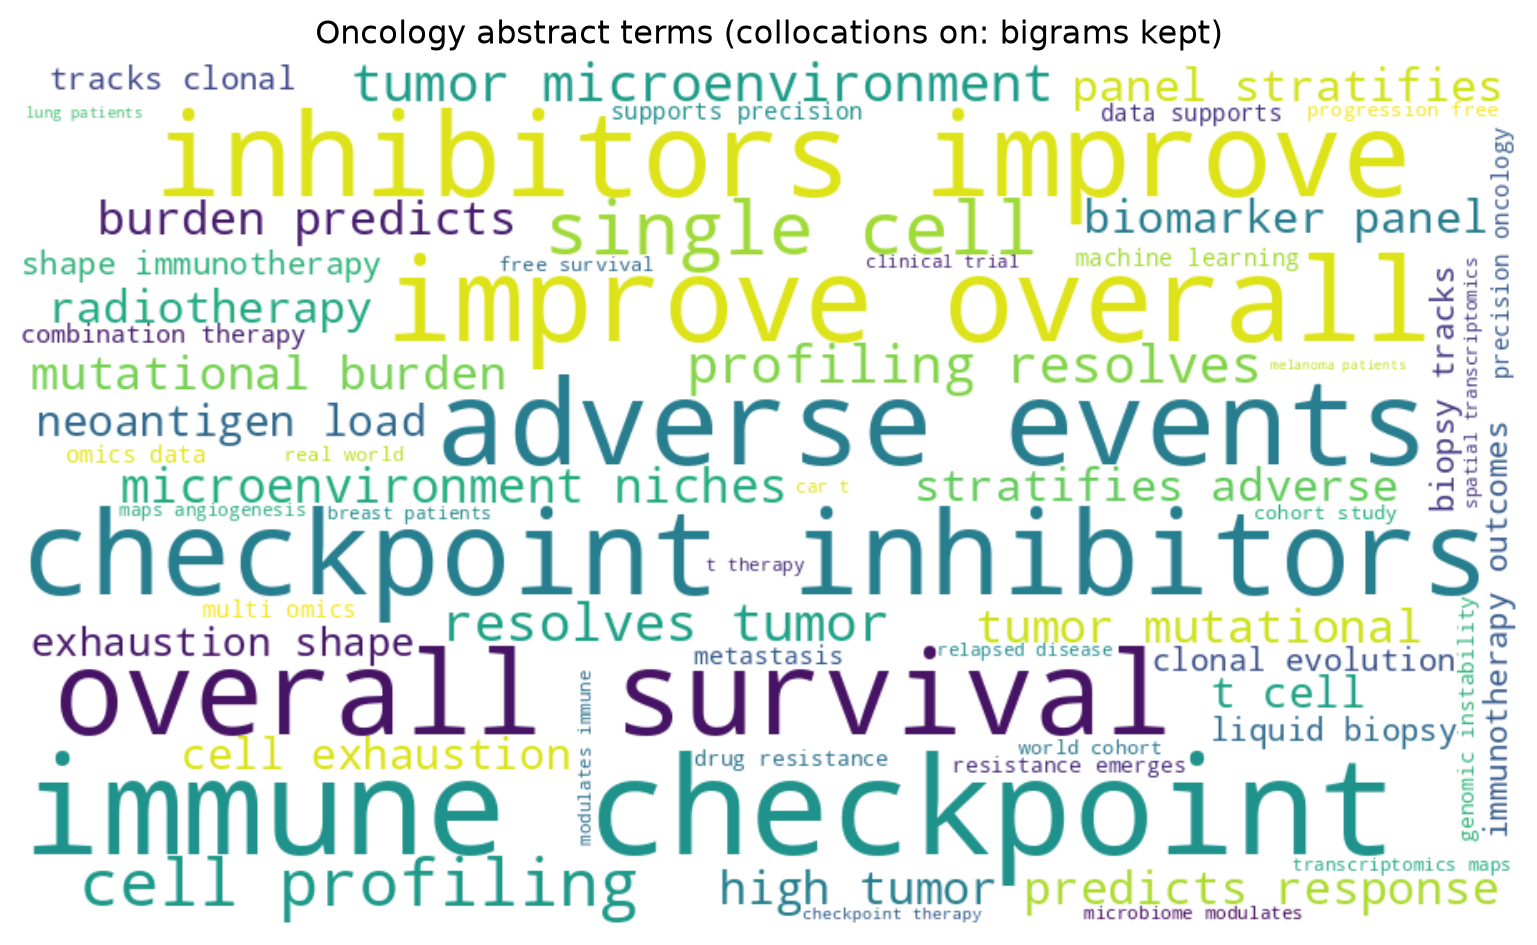
2. Frequency-Driven Cloud for Print
from matplotlib.colors import to_hex
blues = plt.get_cmap("Blues")(np.linspace(0.45, 0.95, 256))

def print_blues(*args, **kwargs):
    return to_hex(blues[rng.integers(0, len(blues))])

wc2 = WordCloud(width=900, height=520, background_color="white",
                random_state=7, max_words=25)
wc2.generate_from_frequencies(freq)
wc2.recolor(color_func=print_blues)
fig, ax = plt.subplots(figsize=(8.5, 5))
ax.imshow(wc2, interpolation="bilinear")
ax.axis("off")
ax.set_title("Top-25 terms from frequencies (sequential palette for print)")
fig.tight_layout()
plt.show()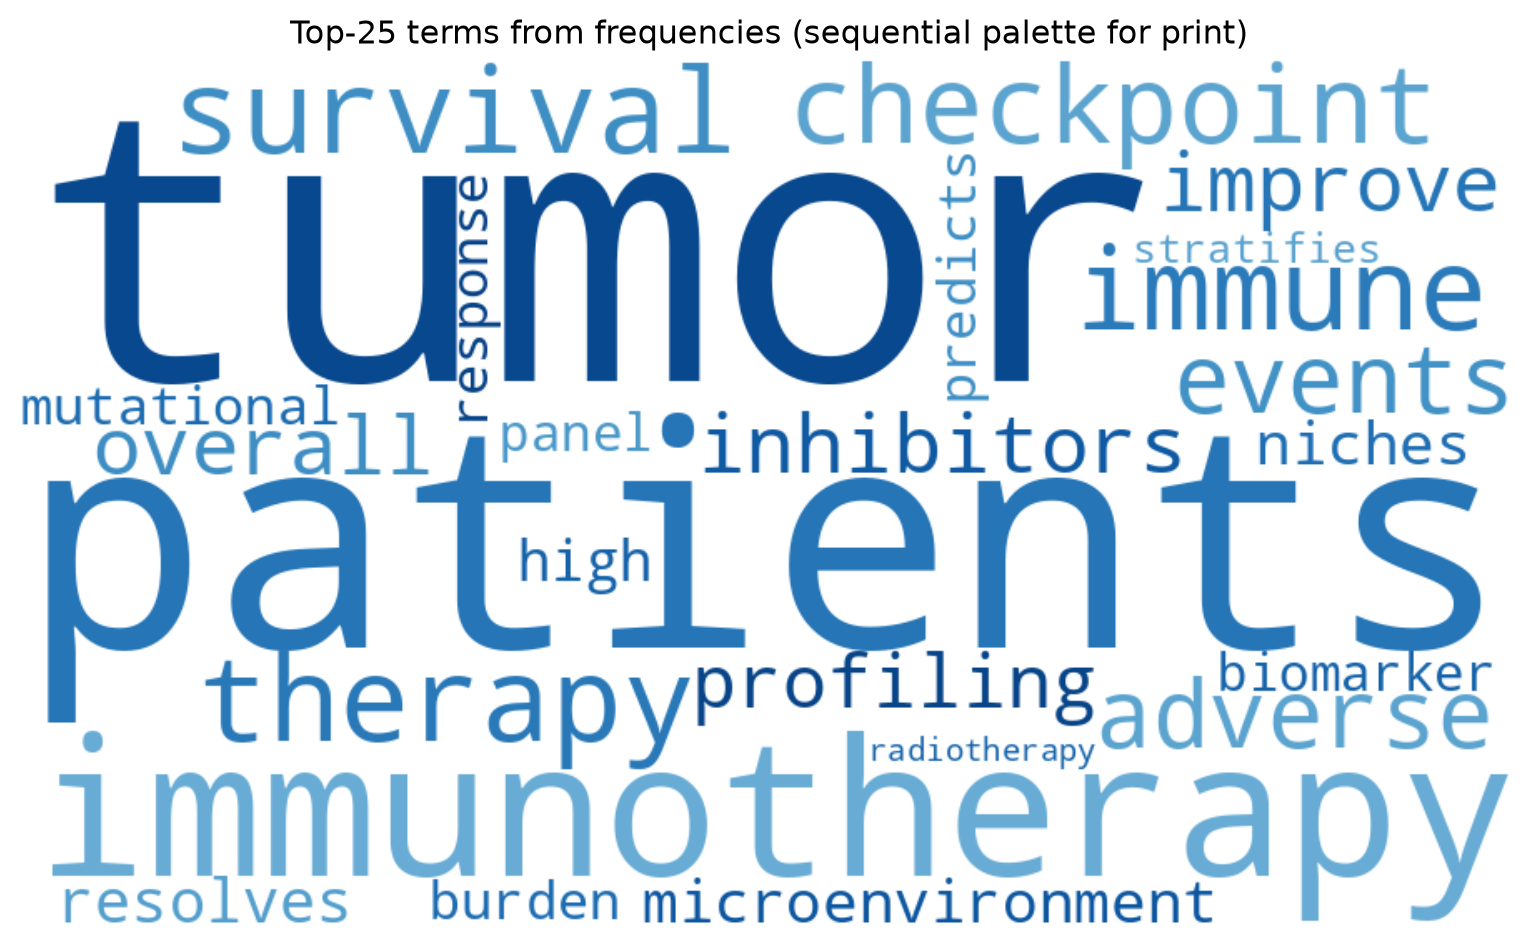
TipPractice tips
- Always pass
random_state=— word placement is randomized, and an unseeded cloud changes shape on every rerun. - Decide collocations deliberately:
Truekeeps multiword concepts,Falsecounts single words; never mix the two modes between figures of the same comparison. - Remove domain stopwords (patient, study, result) before drawing, or they dominate by mere grammatical frequency.
- Word area encodes frequency only approximately (layout packing perturbs it); quote exact counts in a companion table for analysis.
- For Chinese corpora, tokenize with
jiebaand feed frequencies; the default whitespace tokenizer cannot segment Chinese text.
Application
The collocations switch is the most misused setting: with True the corpus keeps “immune checkpoint” as one concept; with False the same corpus splits into “immune” and “checkpoint”, doubling the apparent frequency of each. Show the two clouds side by side when the unit of analysis matters to your claim.
Reference
[1] Müller A. wordcloud: generate word clouds in Python. 2024. https://github.com/amueller/word_cloud