using CairoMakie
using DataFrames
using Statistics
using RandomROC & PR Curve (Julia)
The ROC curve trades sensitivity against (1 − specificity) across every score threshold, summarized by AUC; the precision–recall curve shows the same ranking from the positive-class perspective and is the honest display under class imbalance. Julia’s MLJ has MLJBase receivers for metrics, but the curves themselves are a threshold sweep — fifteen lines of base Julia plus CairoMakie.
Example
Setup
- System Requirements: Cross-platform (Linux/MacOS/Windows)
- Programming Language: Julia
- Dependencies:
CairoMakie,DataFrames,Statistics
Data Preparation
We simulate diagnostic scores for 2,000 patients with 10% prevalence: healthy scores centred at 0, diseased scores shifted upward.
Random.seed!(161)

n = 2000; prevalence = 0.10
label = rand(n) .< prevalence
scores = ifelse.(label, 0.9 .+ 0.55 .* randn(n), 0.65 .* randn(n))

function roc_pr_curve(label, scores)
    order = sortperm(scores; rev = true)
    y = label[order]
    tp = cumsum(y); fp = cumsum(.!y)
    P = sum(y); N = length(y) - P
    tpr = tp ./ P
    fpr = fp ./ N
    recall = tpr
    precision = tp ./ (tp .+ fp)
    auc = sum(diff(fpr) .* (tpr[1:end-1] .+ tpr[2:end]) ./ 2)
    ap = sum(precision[i] * (recall[i-1] - recall[i]) for i in 2:length(recall))
    (tpr, fpr, auc, precision, recall, ap)
end
tpr, fpr, auc_value, precision, recall, ap = roc_pr_curve(label, scores)
([0.004524886877828055, 0.00904977375565611, 0.013574660633484163, 0.013574660633484163, 0.01809954751131222, 0.02262443438914027, 0.027149321266968326, 0.03167420814479638, 0.03619909502262444, 0.04072398190045249 … 1.0, 1.0, 1.0, 1.0, 1.0, 1.0, 1.0, 1.0, 1.0, 1.0], [0.0, 0.0, 0.0, 0.0005621135469364812, 0.0005621135469364812, 0.0005621135469364812, 0.0005621135469364812, 0.0005621135469364812, 0.0005621135469364812, 0.0005621135469364812 … 0.9949409780775716, 0.9955030916245081, 0.9960652051714446, 0.9966273187183811, 0.9971894322653176, 0.9977515458122541, 0.9983136593591906, 0.9988757729061271, 0.9994378864530635, 1.0], 0.8686841710351283, [1.0, 1.0, 1.0, 0.75, 0.8, 0.8333333333333334, 0.8571428571428571, 0.875, 0.8888888888888888, 0.9 … 0.11099949773982923, 0.11094377510040161, 0.11088810837932765, 0.11083249749247744, 0.11077694235588972, 0.11072144288577154, 0.11066599899849774, 0.11061061061061062, 0.11055527763881941, 0.1105], [0.004524886877828055, 0.00904977375565611, 0.013574660633484163, 0.013574660633484163, 0.01809954751131222, 0.02262443438914027, 0.027149321266968326, 0.03167420814479638, 0.03619909502262444, 0.04072398190045249 … 1.0, 1.0, 1.0, 1.0, 1.0, 1.0, 1.0, 1.0, 1.0, 1.0], -0.5071316388350325)Visualization
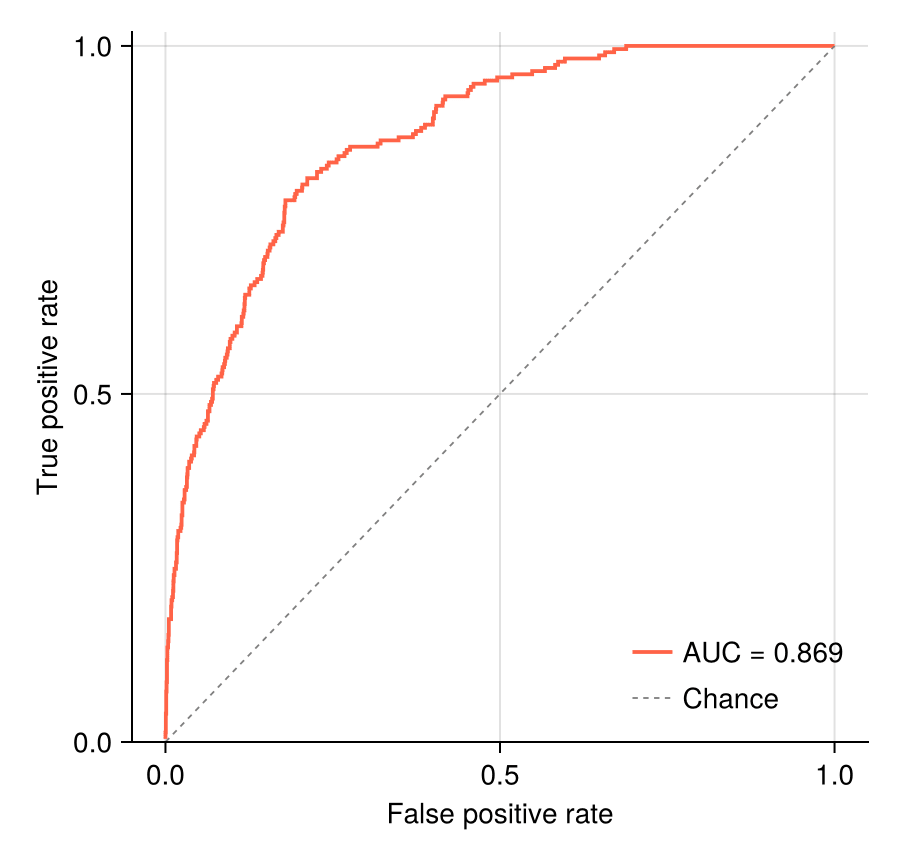
ROC Curve with AUC
The AUC here uses the trapezoid rule over the swept (FPR, TPR) path; the diagonal is the chance classifier.
fig = Figure(size = (450, 430))
ax = Axis(fig[1, 1], xlabel = "False positive rate",
          ylabel = "True positive rate")
lines!(ax, fpr, tpr; color = :tomato, linewidth = 1.9,
       label = "AUC = $(round(auc_value; digits = 3))")
lines!(ax, [0, 1], [0, 1]; color = :gray50, linewidth = 0.9,
       linestyle = :dash, label = "Chance")
axislegend(ax; framevisible = false, position = :rb)
ylims!(ax, 0, 1.02)
hidespines!(ax, :t, :r)
fig
Precision–Recall Curve
With 10% prevalence the chance precision sits at 0.10 (dashed) — a strong ROC can look far less flattering here, which is the point.
fig = Figure(size = (450, 430))
ax = Axis(fig[1, 1], xlabel = "Recall", ylabel = "Precision")
lines!(ax, recall, precision; color = :steelblue, linewidth = 1.9,
       label = "AP = $(round(ap; digits = 3))")
hlines!(ax, [prevalence]; color = :gray50, linewidth = 0.9,
        linestyle = :dash, label = "Prevalence = 0.10")
axislegend(ax; framevisible = false, position = :rt)
ylims!(ax, 0, 1.02)
hidespines!(ax, :t, :r)
fig
References
- Fawcett, T. (2006). An introduction to ROC analysis. Pattern Recognition Letters, 27(8), 861-874.
- Saito, T., & Rehmsmeier, M. (2015). The Precision-Recall Plot Is More Informative than the ROC Plot When Evaluating Binary Classifiers on Imbalanced Datasets. PLoS ONE, 10(3), e0118432.