# Installing necessary packages
if (!requireNamespace("ComplexHeatmap", quietly = TRUE)) {
  BiocManager::install("ComplexHeatmap")
}
if (!requireNamespace("ggplot2", quietly = TRUE)) {
  install.packages("ggplot2")
}
if (!requireNamespace("dplyr", quietly = TRUE)) {
  install.packages("dplyr")
}
if (!requireNamespace("circlize", quietly = TRUE)) {
  install.packages("circlize")
}

# Load packages
library(ComplexHeatmap)
library(ggplot2)
library(dplyr)
library(circlize)Stemness Index (mRNAsi) Plot
The mRNA-expression-based stemness index (mRNAsi) is the first principal component of a stemness gene-signature expression matrix, rescaled to 0–1 [1]. Publication figures sort samples by mRNAsi and stack the known clinical features underneath as colour strips, so the reader sees which subgroups carry the dedifferentiated end of the axis.
Example

Setup
System Requirements: Cross-platform (Linux/MacOS/Windows)
Programming Language: R
Dependent packages:
ComplexHeatmap;ggplot2;dplyr;circlize
sessioninfo::session_info("attached")─ Session info ───────────────────────────────────────────────────────────────
setting value
version R version 4.6.2 (2026-10-29)
os Ubuntu 26.04.1 LTS
system x86_64, linux-gnu
ui X11
language (EN)
collate C.UTF-8
ctype C.UTF-8
tz UTC
date 2026-11-05
pandoc 3.7.0.2 @ /usr/bin/ (via rmarkdown)
quarto 1.11.9 @ /usr/local/bin/quarto
─ Packages ───────────────────────────────────────────────────────────────────
! package * version date (UTC) lib source
P circlize * 0.4.18 2026-04-04 [?] RSPM
P ComplexHeatmap * 2.28.0 2026-04-28 [?] Bioconductor 3.23 (R 4.6.2)
P dplyr * 1.2.1 2026-04-03 [?] RSPM
P ggplot2 * 4.0.3.9000 2026-11-03 [?] Github (tidyverse/ggplot2@b638d65)
[1] /home/runner/.cache/R/renv/library/Bizard-5140bdc6/linux-ubuntu-resolute/R-4.6/x86_64-pc-linux-gnu
[2] /home/runner/work/_temp/Library
[3] /opt/R/4.6.2/lib/R/library
* ── Packages attached to the search path.
P ── Loaded and on-disk path mismatch.
──────────────────────────────────────────────────────────────────────────────Data Preparation
With real data, mRNAsi comes from projecting your tumour expression matrix onto the PCBC stemness signature (the reference workflow’s pcbc-stemsig file). We simulate the projection output directly: 60 medulloblastoma-like samples, a continuous mRNAsi, and two clinical features.
set.seed(1101)
n_sam <- 60
samples <- paste0("MB-", sprintf("%02d", 1:n_sam))
subgroup <- sample(c("Group3", "SHH", "Group4", "WNT"), n_sam,
                   replace = TRUE, prob = c(0.3, 0.3, 0.3, 0.1))
metastasis <- sample(c("M0", "M1"), n_sam, replace = TRUE, prob = c(0.6, 0.4))
# latent stemness z-score: Group3/Group4 high, WNT low, M1 higher (as in the
# reference) — rescale to 0..1 only AFTER the effects, and do NOT re-sort, or
# the values decouple from the clinical features
z <- rnorm(n_sam) + 0.9 * (subgroup %in% c("Group3", "Group4")) -
  0.8 * (subgroup == "WNT") + 0.3 * (metastasis == "M1")
mRNAsi <- pnorm(z)

clin <- data.frame(sample = samples,
                   mRNAsi = mRNAsi,
                   Subgroup = subgroup,
                   Metastasis = metastasis)
head(clin, 3)
sample mRNAsi Subgroup Metastasis
1 MB-01 0.10727263 Group3 M1
2 MB-02 0.05475588 SHH M0
3 MB-03 0.75430268 Group4 M1Visualization
1. Samples Sorted by mRNAsi with Clinical Strips
ord <- order(clin$mRNAsi)
mat <- rbind(mRNAsi = clin$mRNAsi[ord])
rownames(mat) <- "mRNAsi"
col_fun <- circlize::colorRamp2(c(0, 0.5, 1), c("#445EAD", "white", "#B31E22"))

ha_top <- HeatmapAnnotation(
  mRNAsi = anno_simple(mat["mRNAsi", ], col = col_fun),
  Subgroup = clin$Subgroup[ord],
  Metastasis = clin$Metastasis[ord],
  col = list(Subgroup = c("Group3" = "#B31E22", "SHH" = "#529B40",
                          "Group4" = "#383D8E", "WNT" = "#EABF00"),
             Metastasis = c(M0 = "#dcddde", M1 = "#700353")),
  annotation_name_side = "left")

Heatmap(mat, name = "mRNAsi", top_annotation = ha_top,
        col = col_fun, cluster_columns = FALSE, cluster_rows = FALSE,
        show_column_names = FALSE, show_row_names = FALSE,
        border = TRUE, width = unit(18, "cm"))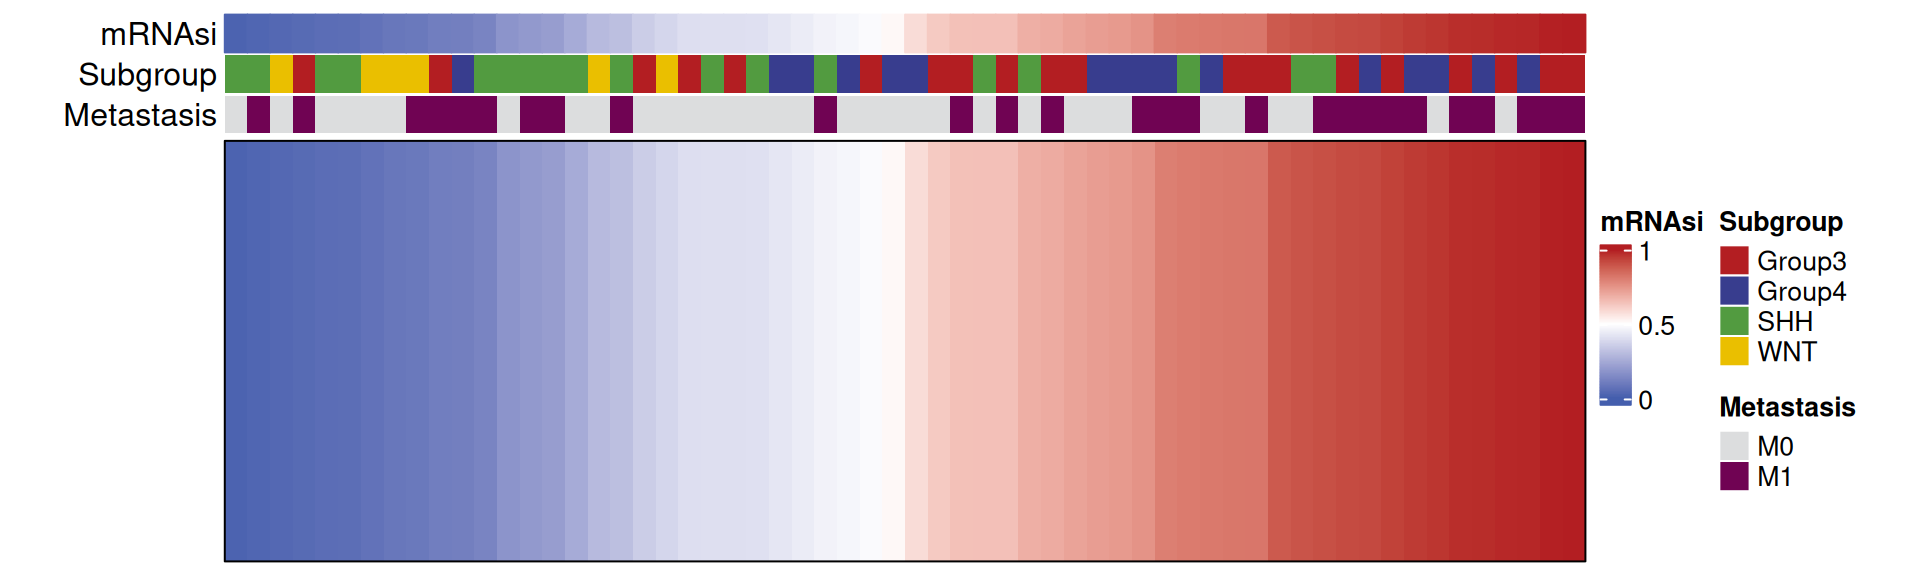
2. mRNAsi by Molecular Subgroup
p_kw <- kruskal.test(mRNAsi ~ Subgroup, data = clin)$p.value
sub_order <- c("WNT", "SHH", "Group4", "Group3")

ggplot(clin, aes(factor(Subgroup, sub_order), mRNAsi, fill = Subgroup)) +
  geom_boxplot(outlier.shape = NA, width = 0.6) +
  geom_jitter(width = 0.12, size = 0.8, alpha = 0.5, show.legend = FALSE) +
  scale_fill_manual(values = c("Group3" = "#B31E22", "SHH" = "#529B40",
                               "Group4" = "#383D8E", "WNT" = "#EABF00")) +
  labs(title = sprintf("mRNAsi by subgroup (Kruskal-Wallis %s)",
       ifelse(p_kw < 0.001, "p < 0.001", sprintf("p = %.3f", p_kw))),
       x = NULL, y = "mRNAsi", fill = NULL) +
  theme_classic(base_size = 11) +
  theme(legend.position = "none")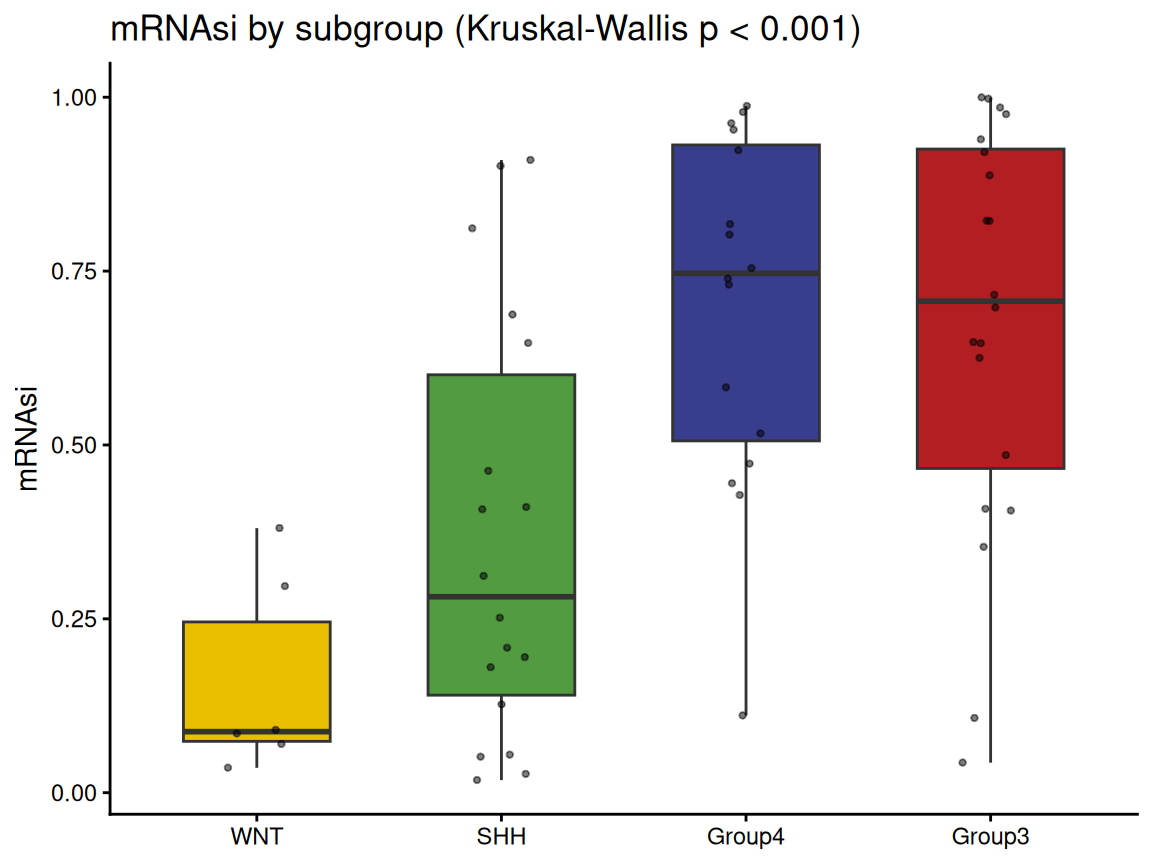
Tip
Practice tips
- mDNAsi (the methylation-based index) is drawn with the identical layout — swap the top row and re-run.
- The strips must be ordered by the same sort as the index; annotating an unsorted matrix destroys the whole point of the figure.
- For real data, project your log2-expression matrix onto the PCBC signature with
prcomp()and take PC1 (mRNAsi = PC1 / max(PC1)rescaled to 0–1); the reference workflow ships the signature file.
Application
Stemness indices are compared across molecular subgroups, stages and therapies; high-mRNAsi tumours are typically the dedifferentiated, aggressive end of the cohort. The sorted-strip figure is the standard overview.
Reference
[1] Malta TM, Sokolov A, Gentles AJ, et al. Machine learning identifies stemness features associated with oncogenic dedifferentiation. Cell. 2018;173(2):338-354.e15. doi:10.1016/j.cell.2018.03.034
[2] Xiaofan Lu, et al. FigureYa: A Standardized Visualization Framework for Enhancing Biomedical Data Interpretation and Research Efficiency. iMetaMed. 2025. doi:10.1002/imm3.70005