import matplotlib.pyplot as plt
import numpy as np
from pycirclize import CircosCircos & Chord Plot (Python)
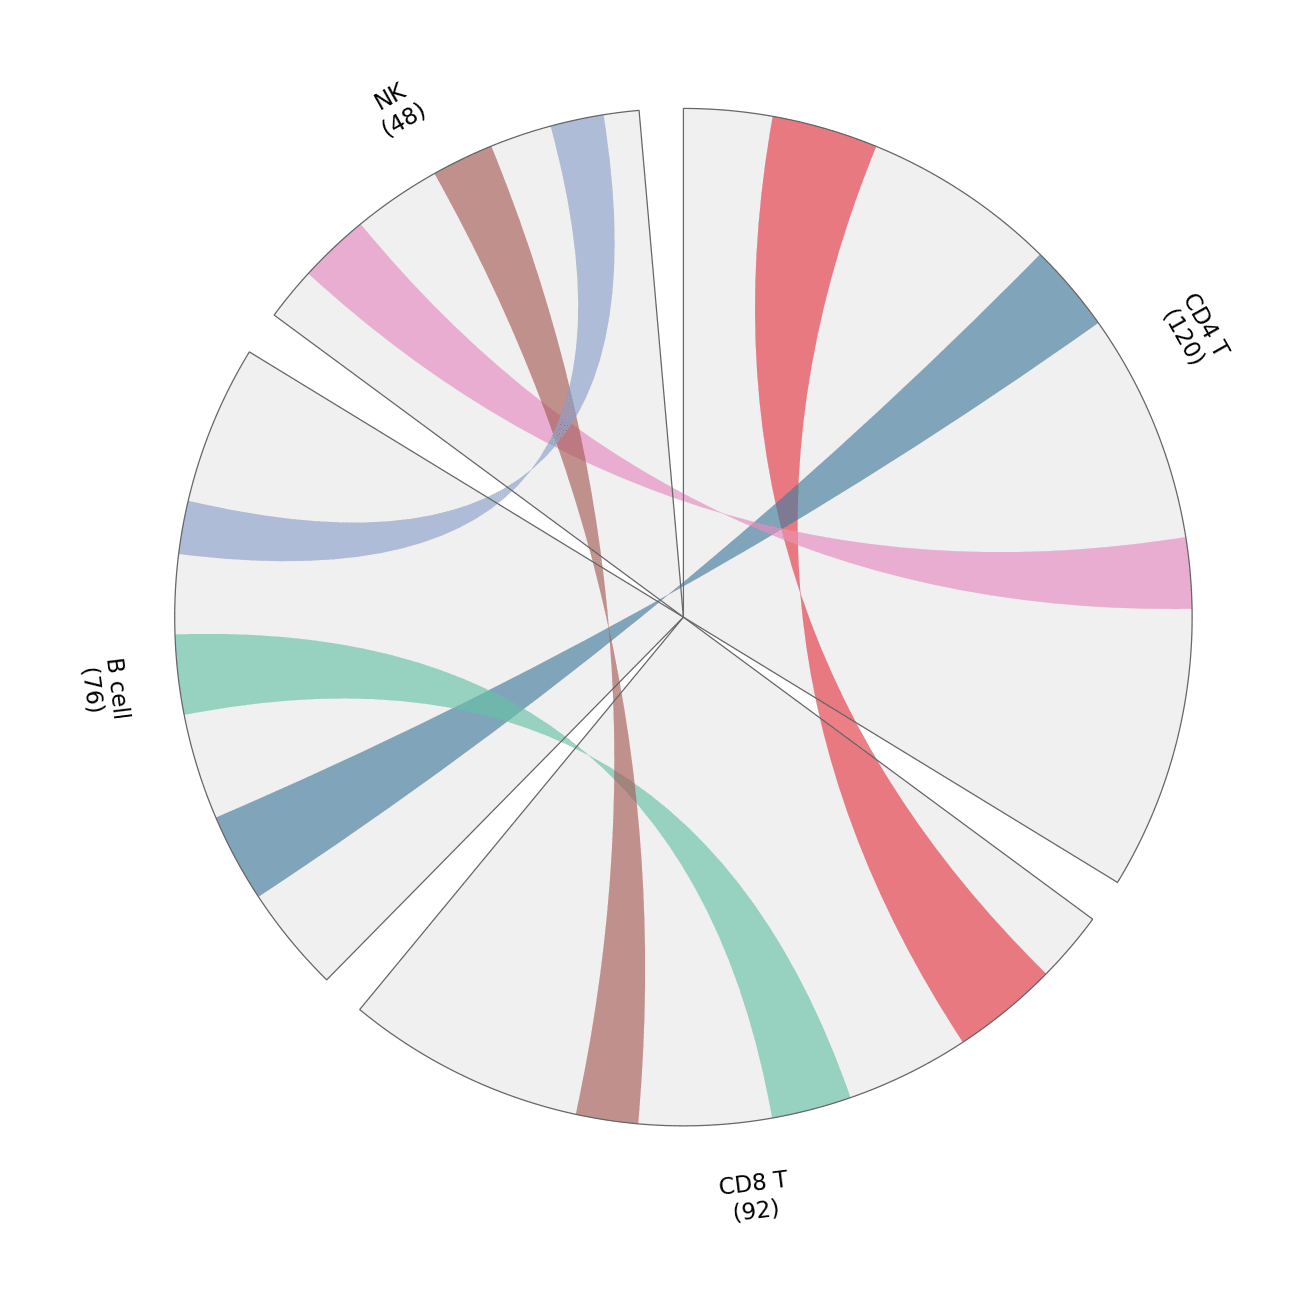
Circos layouts arrange sectors on a circle; chord diagrams connect sectors with arcs whose widths encode flow volume. In biomedical research they summarize gene sharing between cell types, cohort overlaps, or genome-scale rearrangements in one dense-but-readable figure. pyCirclize builds both from a sector dictionary plus link tuples — the same API also drives genomic-feature tracks.
Example
Setup
- System Requirements: Cross-platform (Linux/MacOS/Windows)
- Programming Language: Python
- Dependencies:
matplotlib,pyCirclize
Data Preparation
We count marker-gene sharing between four immune cell types; each sector’s size is the cell type’s marker count, and each link’s width is the number of shared markers.
marker_counts = {'CD4 T': 120, 'CD8 T': 92, 'B cell': 76, 'NK': 48}
shared = [
    (('CD4 T', 10, 22), ('CD8 T', 8, 20)),     # 12 shared markers
    (('CD4 T', 44, 54), ('B cell', 12, 22)),   # 10 shared markers
    (('CD8 T', 34, 43), ('B cell', 34, 43)),   # 9 shared markers
    (('CD4 T', 80, 88), ('NK', 6, 14)),        # 8 shared markers
    (('CD8 T', 58, 65), ('NK', 24, 31)),       # 7 shared markers
    (('B cell', 52, 58), ('NK', 38, 44)),      # 6 shared markers
]
link_colors = ['#e63946', '#457b9d', '#66c2a5', '#e78ac3', '#a65d57', '#8da0cb']
Visualization
Chord Diagram of Shared Markers
Sector size shows how many markers each cell type contributes; ribbon width and colour show pairwise sharing — legend the colours, because arc geometry alone is hard to read.
circos = Circos(marker_counts, space=5)
for sector in circos.sectors:
    sector.axis(fc='#f0f0f0', ec='0.4', lw=0.6)
    sector.text(f'{sector.name}\n({sector.size})', r=110, size=11)
for (src, dst), color in zip(shared, link_colors):
    circos.link(src, dst, color=color, alpha=0.65)

fig = circos.plotfig()
plt.tight_layout()
plt.show()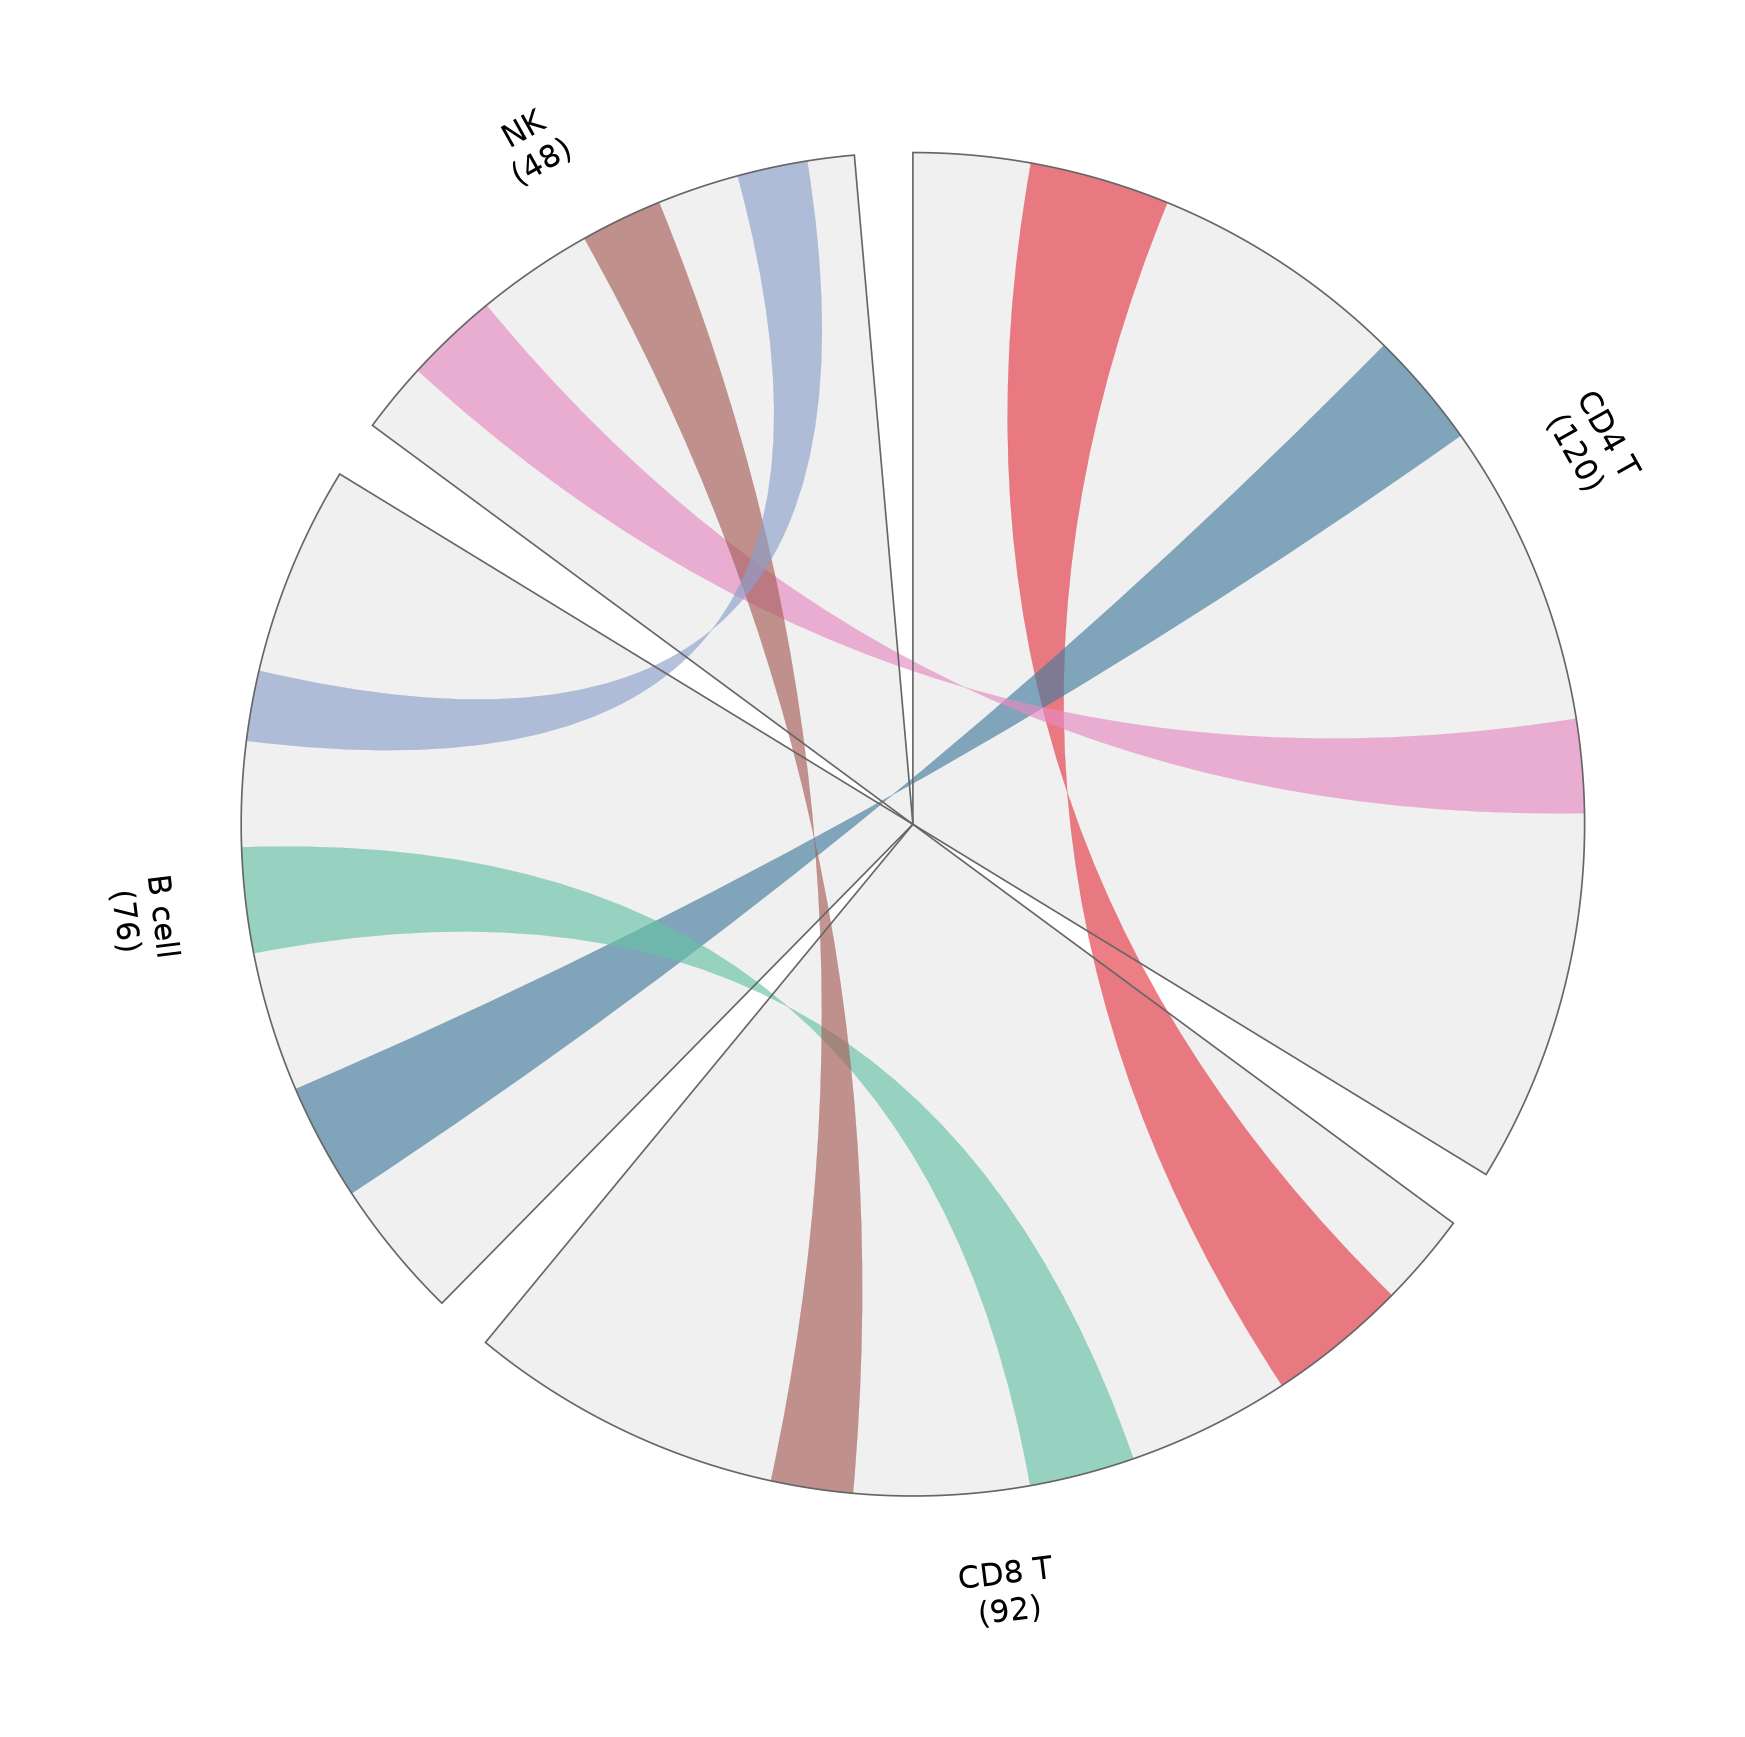
Sector Tracks with a Genomic-Style Layout
The same sector framework also hosts stacked tracks (heatmaps, bars, points) — here a simple bar track shows per-cell-type marker density along its sector.
rng = np.random.default_rng(191)
bar_values = {name: rng.integers(20, 100, 8) for name in marker_counts}

circos = Circos(marker_counts, space=5)
for sector in circos.sectors:
    sector.axis(fc='#f7f7f7', ec='0.4', lw=0.6)
    sector.text(f'{sector.name} ({sector.size})', r=118, size=11)
    track = sector.add_track((78, 96))
    track.axis(fc='#efefef')
    positions = np.linspace(sector.start + 1, sector.end - 1, 8)
    track.bar(positions, bar_values[sector.name],
              width=positions[1] - positions[0] * 0.7, color='#8da0cb')

fig = circos.plotfig()
plt.tight_layout()
plt.show()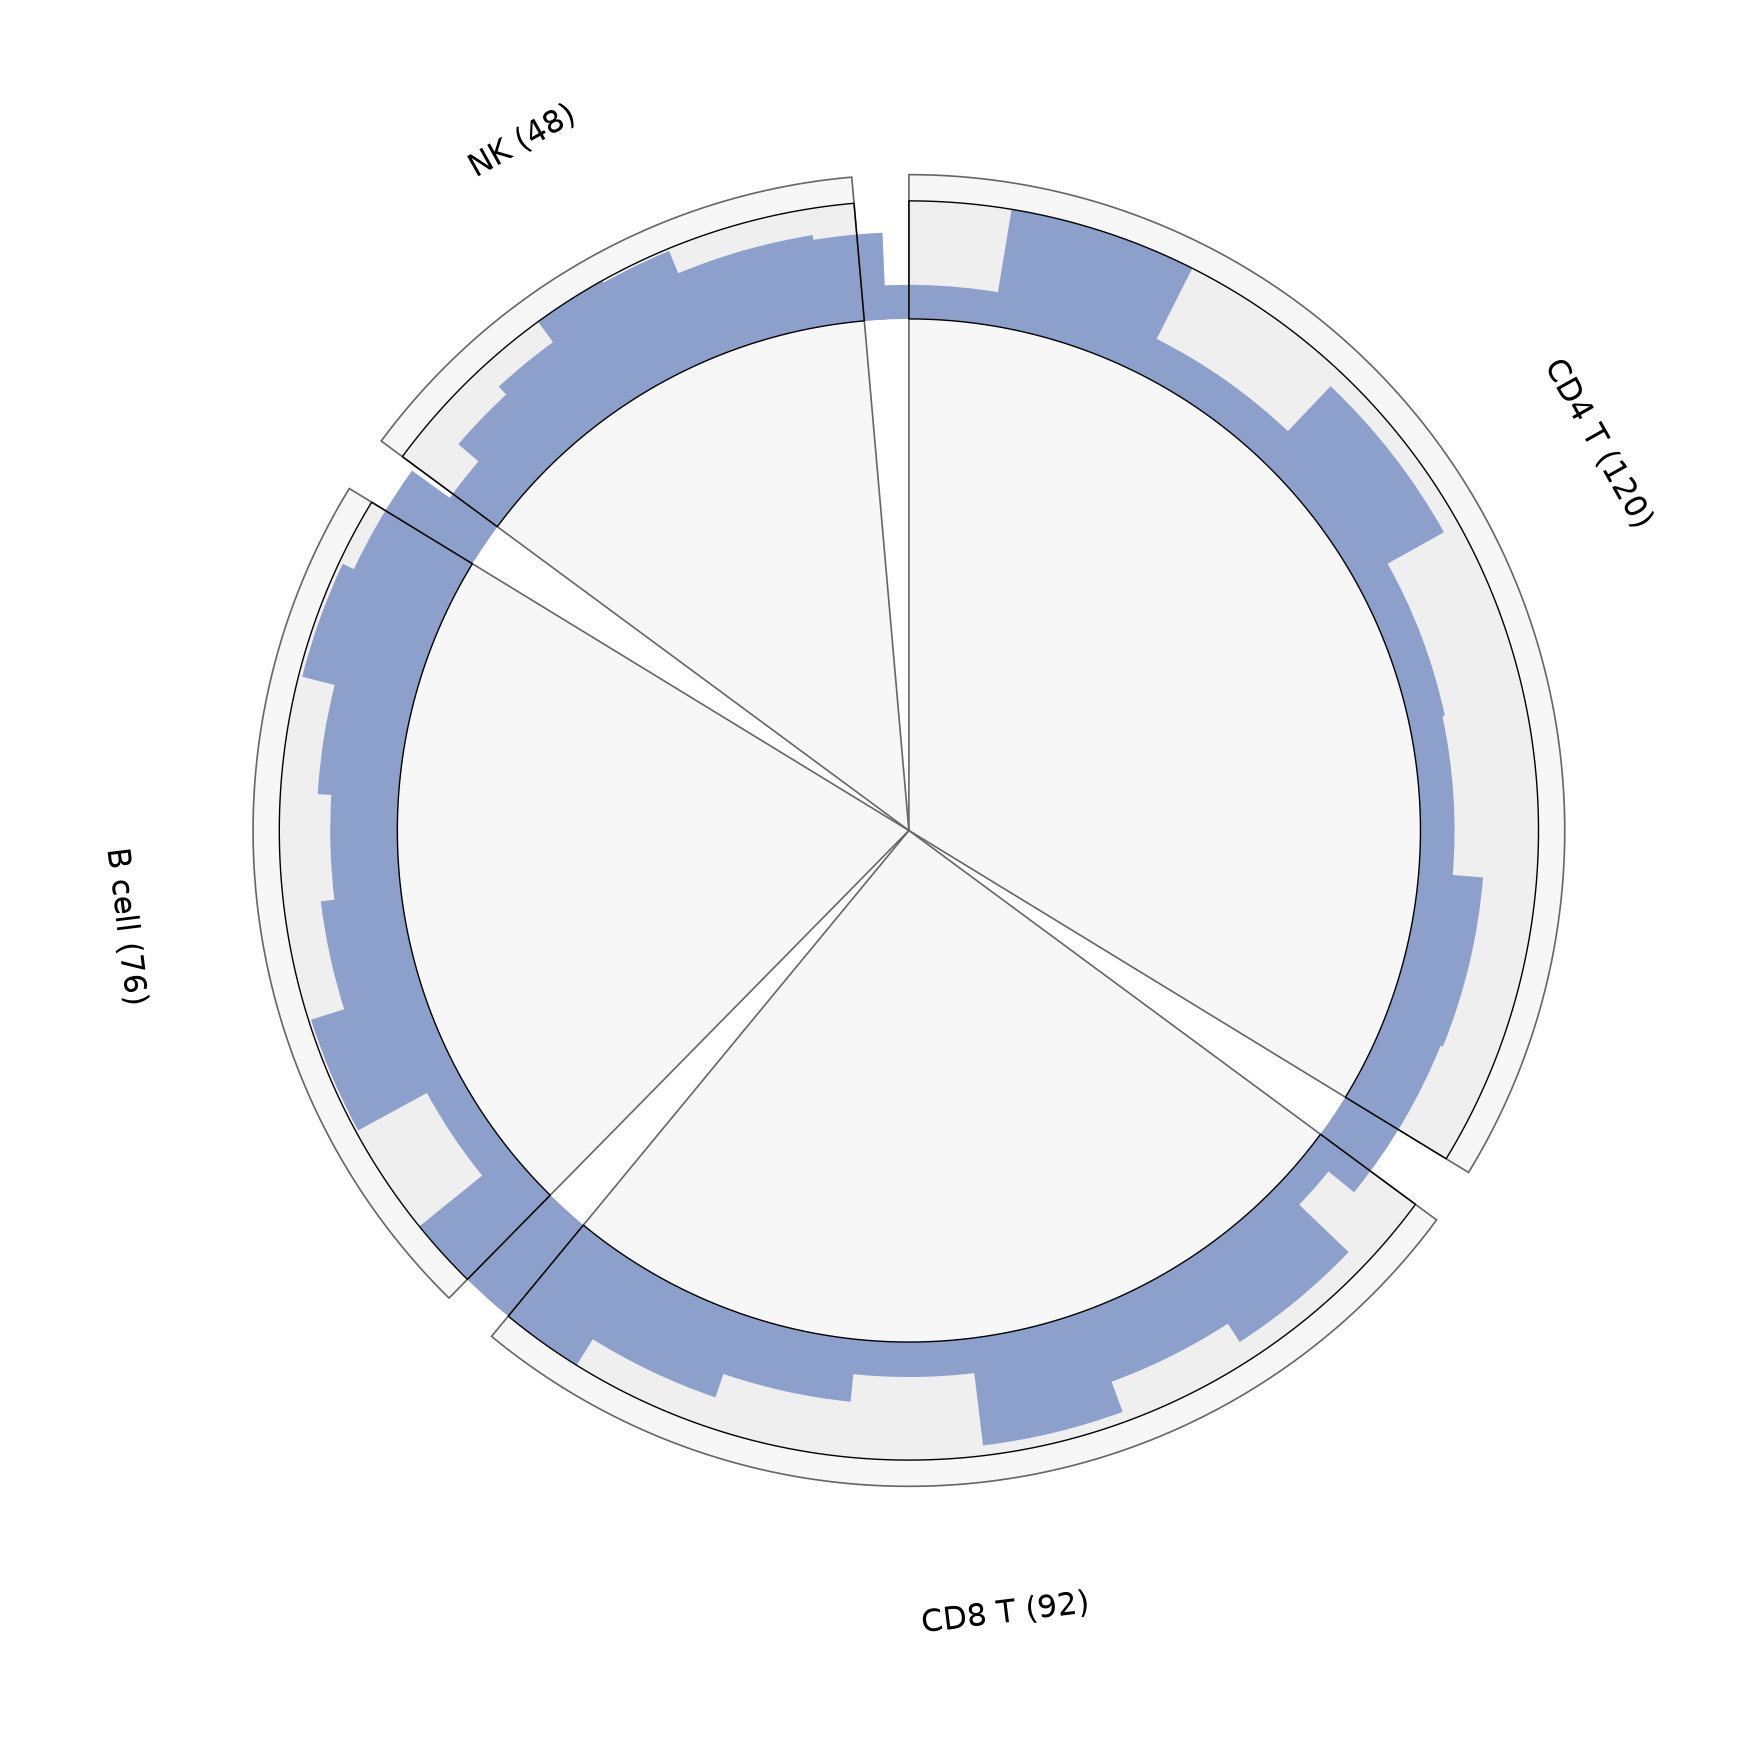
References
- Moshi4. pyCirclize: Circular visualization in Python. https://github.com/moshi4/pyCirclize
- Krzywinski, M., et al. (2009). Circos: An Information Aesthetic for Comparative Genomics. Genome Research, 19(9), 1639-1645.