# Install packages
if (!requireNamespace("data.table", quietly = TRUE)) {
  install.packages("data.table")
}
if (!requireNamespace("jsonlite", quietly = TRUE)) {
  install.packages("jsonlite")
}
if (!requireNamespace("shape", quietly = TRUE)) {
  install.packages("shape")
}
if (!requireNamespace("ggplotify", quietly = TRUE)) {
  install.packages("ggplotify")
}

# Load packages
library(data.table)
library(jsonlite)
library(shape)
library(ggplotify)Perspective
Note
Hiplot website
This page is the tutorial for source code version of the Hiplot Perspective plugin. You can also use the Hiplot website to achieve no code ploting. For more information please see the following link:
The three-dimensional perspective is a three-dimensional figure that can connect the higher values contained in a matrix with surfaces.
Setup
System Requirements: Cross-platform (Linux/MacOS/Windows)
Programming language: R
Dependent packages:
data.table;jsonlite;shape;ggplotify
sessioninfo::session_info("attached")─ Session info ───────────────────────────────────────────────────────────────
setting value
version R version 4.6.0 (2026-04-24)
os Ubuntu 24.04.4 LTS
system x86_64, linux-gnu
ui X11
language (EN)
collate C.UTF-8
ctype C.UTF-8
tz UTC
date 2026-05-09
pandoc 3.1.3 @ /usr/bin/ (via rmarkdown)
quarto 1.9.37 @ /usr/local/bin/quarto
─ Packages ───────────────────────────────────────────────────────────────────
package * version date (UTC) lib source
data.table * 1.18.4 2026-05-06 [1] RSPM
ggplotify * 0.1.3 2025-09-20 [1] RSPM
jsonlite * 2.0.0 2025-03-27 [1] RSPM
shape * 1.4.6.1 2024-02-23 [1] RSPM
[1] /home/runner/work/_temp/Library
[2] /opt/R/4.6.0/lib/R/site-library
[3] /opt/R/4.6.0/lib/R/library
* ── Packages attached to the search path.
──────────────────────────────────────────────────────────────────────────────Data Preparation
The loaded data is a matrix.
# Load data
data <- data.table::fread(jsonlite::read_json("https://hiplot.cn/ui/basic/perspective/data.json")$exampleData$textarea[[1]])
data <- as.data.frame(data)

# Convert data structure
data <- as.matrix(data)
col <- drapecol(data)

# View data
head(data[,1:5])
V1 V2 V3 V4 V5
[1,] 100 101 102 103 104
[2,] 100 101 102 103 104
[3,] 101 102 103 104 105
[4,] 101 102 103 104 105
[5,] 101 102 103 104 105
[6,] 101 102 103 104 105Visualization
# Perspective
p <- as.ggplot(function() {
  persp(as.matrix(data),
    theta = 45, phi = 20,
    expand = 0.5,
    r = 180, col = col,
    ltheta = 120,
    shade = 0.5,
    ticktype = "detailed",
    xlab = "X", ylab = "Y", zlab = "Z",
    border = "black" # could be NA
  )
  title("Perspective Plot", line = 0)
})

p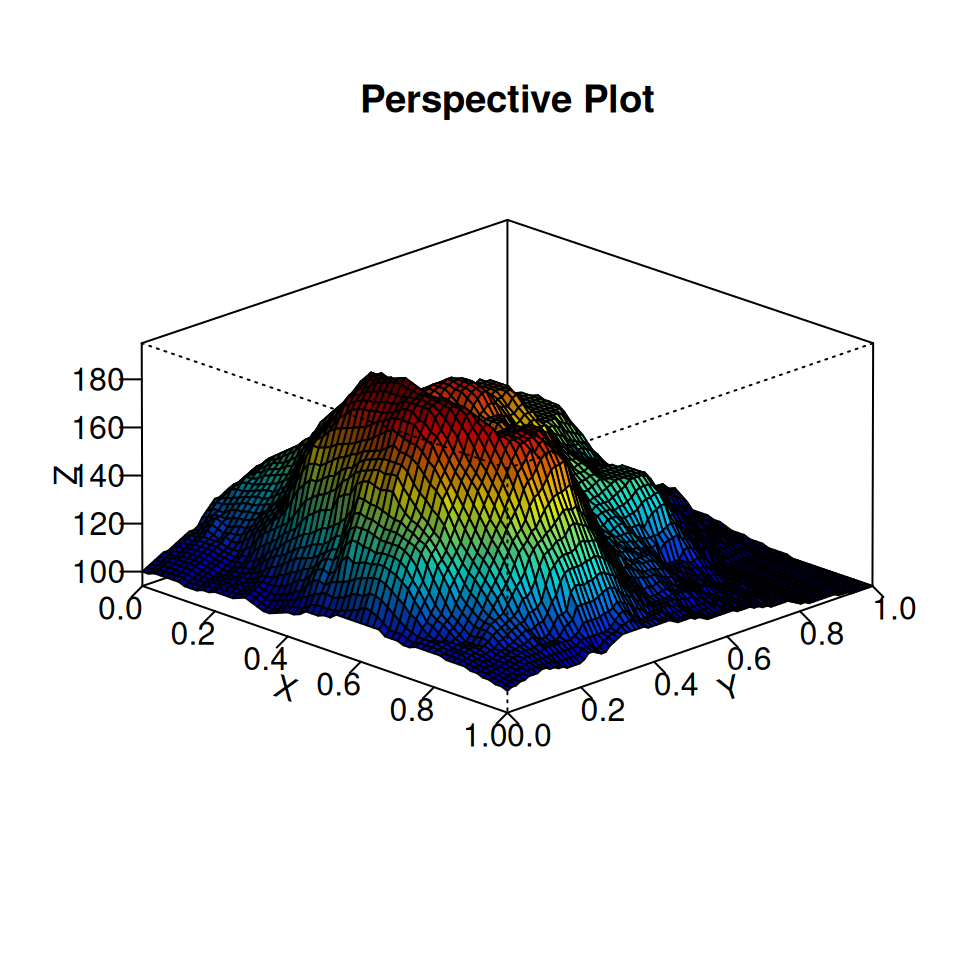
A clear view of a mountain peak.