import matplotlib.pyplot as plt
import pandas as pd
import numpy as npUpSet Plot (Python)
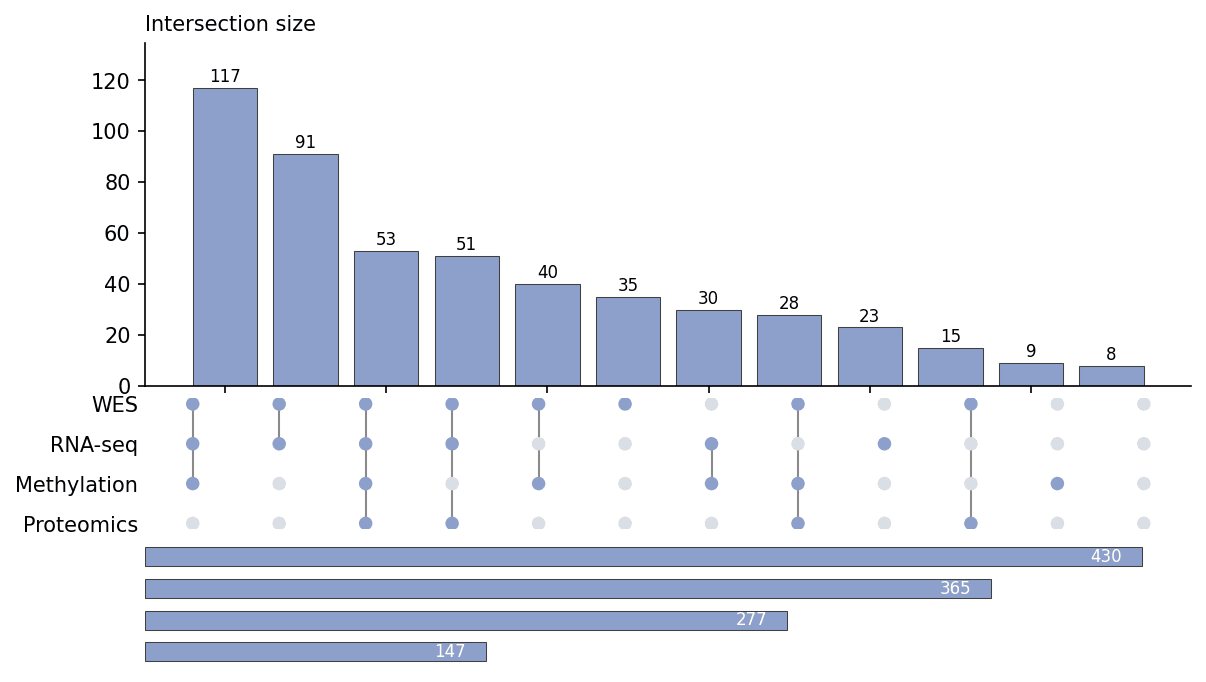
An UpSet plot visualizes the intersections of many sets as a matrix of dots (which sets take part) above a bar chart (how large each intersection is), scaling where Venn diagrams fail beyond three sets. In biomedical research it is the standard view of mutation or gene-list intersections across cohorts, platforms, and subtypes. matplotlib builds it from three aligned panels — intersection bars, the membership matrix, and per-set totals — with no extra dependency.
Example
Setup
- System Requirements: Cross-platform (Linux/MacOS/Windows)
- Programming Language: Python
- Dependencies:
matplotlib,pandas,numpy
Data Preparation
We summarize which of four omics platforms (WES, RNA-seq, methylation array, proteomics) covered each gene in a 500-gene panel, then aggregate to intersection sizes — one row per membership pattern.
np.random.seed(81)

platforms = ['WES', 'RNA-seq', 'Methylation', 'Proteomics']
p_present = [0.85, 0.70, 0.55, 0.35]
n_genes = 500

membership = pd.DataFrame(
    np.random.random((n_genes, 4)) < p_present, columns=platforms)
membership['Proteomics'] &= membership['WES']   # paired platforms correlate

intersections = membership.groupby(platforms, observed=True).size()
intersections = intersections.sort_values(ascending=False)
set_sizes = membership.sum()
Visualization
Hand-Built UpSet Plot
Three vertically aligned panels share the intersection x-axis: bars for sizes, the dot matrix for membership, and horizontal bars for set totals.
n_int = len(intersections)
xs = np.arange(n_int)

fig, (ax_size, ax_mat, ax_sets) = plt.subplots(
    3, 1, figsize=(9, 5.4), sharex=False,
    gridspec_kw={'height_ratios': [3, 1.15, 1.1], 'hspace': 0.06})

ax_size.bar(xs, intersections.values, color='#8da0cb',
            edgecolor='0.25', linewidth=0.5)
for x, v in zip(xs, intersections.values):
    ax_size.text(x, v + max(intersections) * 0.02, str(v),
                 ha='center', fontsize=8)
ax_size.set_ylim(0, max(intersections) * 1.15)
ax_size.set_title('Intersection size', loc='left', fontsize=10)
ax_size.spines[['top', 'right']].set_visible(False)

for x, (pattern, size) in enumerate(intersections.items()):
    rows = [i for i, on in enumerate(pattern) if on]
    if rows:
        ax_mat.plot([x, x], [min(rows), max(rows)], color='0.55', linewidth=1)
    for i, on in enumerate(pattern):
        ax_mat.scatter(x, i, s=42,
                       color='#8da0cb' if on else '#d9dee6',
                       edgecolor='none', zorder=3)
ax_mat.set_yticks(range(len(platforms)), platforms)
ax_mat.invert_yaxis()
ax_mat.set_xticks([])
ax_mat.spines[['top', 'right', 'left', 'bottom']].set_visible(False)
ax_mat.tick_params(length=0)

ax_sets.barh(range(len(platforms)), set_sizes[platforms].values,
             color='#8da0cb', edgecolor='0.25', linewidth=0.5, height=0.6)
ax_sets.invert_yaxis()
ax_sets.set_xticks([]); ax_sets.set_yticks([])
ax_sets.spines[['top', 'right', 'left', 'bottom']].set_visible(False)
ax_sets.tick_params(length=0)
for i, v in enumerate(set_sizes[platforms].values):
    ax_sets.text(v - max(set_sizes) * 0.02, i, str(v), va='center',
                 ha='right', fontsize=8, color='white')

plt.show()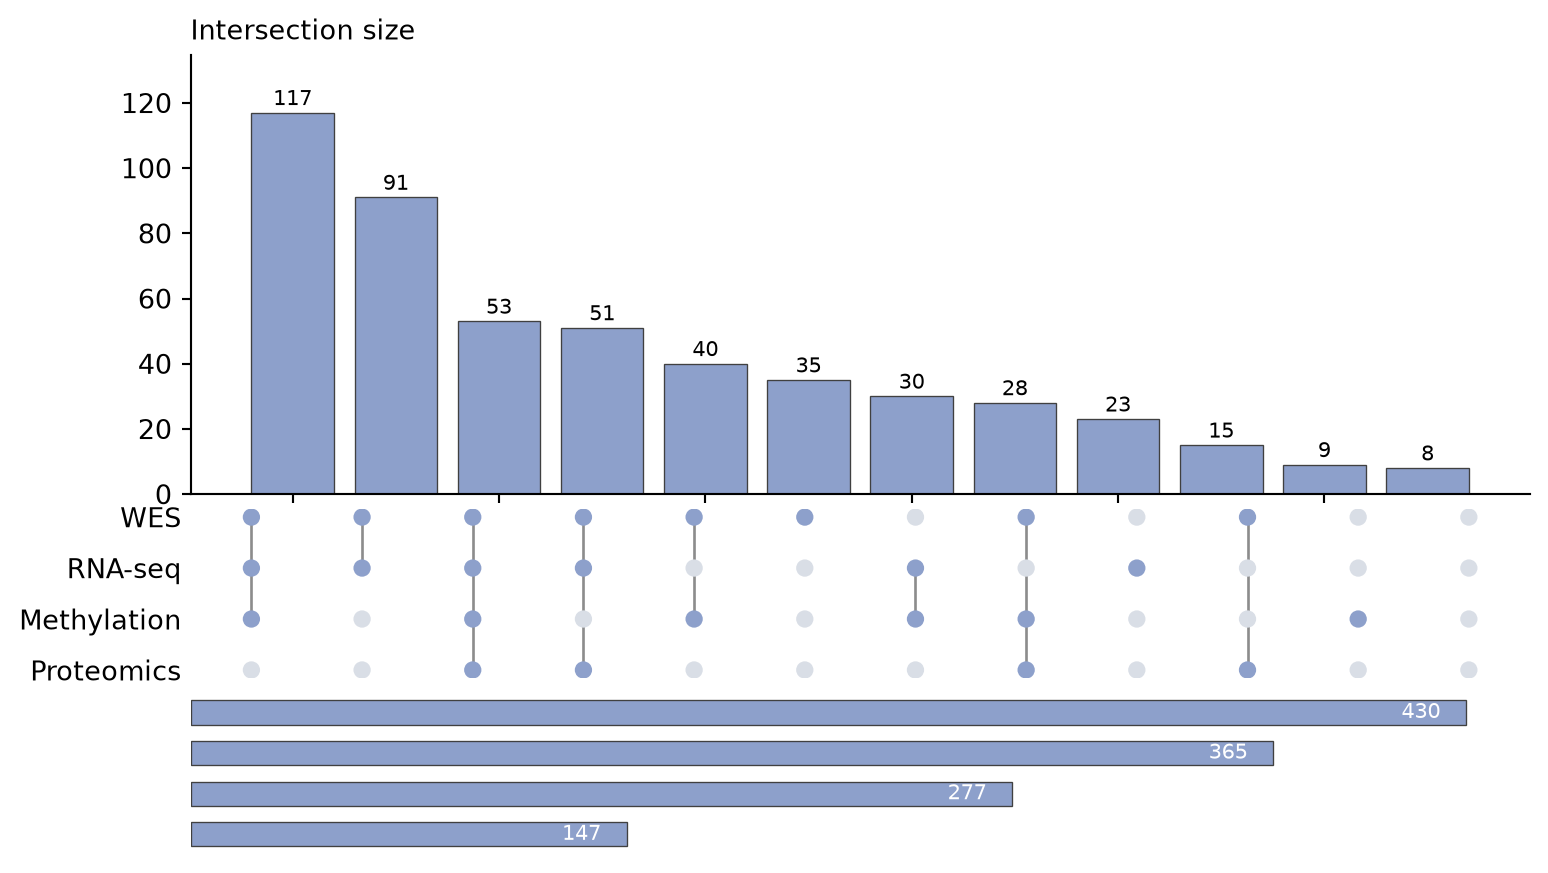
Sorted by Coverage Degree
Sorting intersections by how many platforms they involve turns the chart into a data-completeness statement; annotate row shares to close the read.
degree = np.asarray(intersections.index.to_frame(index=False).sum(axis=1))
order = np.argsort(-degree, kind='stable')
by_degree = intersections.iloc[order]

n_int = len(by_degree)
xs = np.arange(n_int)

fig, (ax_size, ax_mat) = plt.subplots(
    2, 1, figsize=(9, 4.6), sharex=False,
    gridspec_kw={'height_ratios': [3, 1.15], 'hspace': 0.07})

full_coverage = degree[order] == len(platforms)
ax_size.bar(xs, by_degree.values,
            color=['#e63946' if f else '#8da0cb' for f in full_coverage],
            edgecolor='0.25', linewidth=0.5)
for x, v in zip(xs, by_degree.values):
    ax_size.text(x, v + max(by_degree) * 0.02, str(v), ha='center', fontsize=8)
ax_size.set_ylim(0, max(by_degree) * 1.15)
ax_size.set_title('Intersection size (red = all four platforms)',
                  loc='left', fontsize=10)
ax_size.spines[['top', 'right']].set_visible(False)

for x, (pattern, size) in enumerate(by_degree.items()):
    rows = [i for i, on in enumerate(pattern) if on]
    if rows:
        ax_mat.plot([x, x], [min(rows), max(rows)], color='0.55', linewidth=1)
    for i, on in enumerate(pattern):
        ax_mat.scatter(x, i, s=42,
                       color='#8da0cb' if on else '#d9dee6',
                       edgecolor='none', zorder=3)
ax_mat.set_yticks(range(len(platforms)), platforms)
ax_mat.invert_yaxis()
ax_mat.set_xticks([])
ax_mat.spines[['top', 'right', 'left', 'bottom']].set_visible(False)
ax_mat.tick_params(length=0)

plt.show()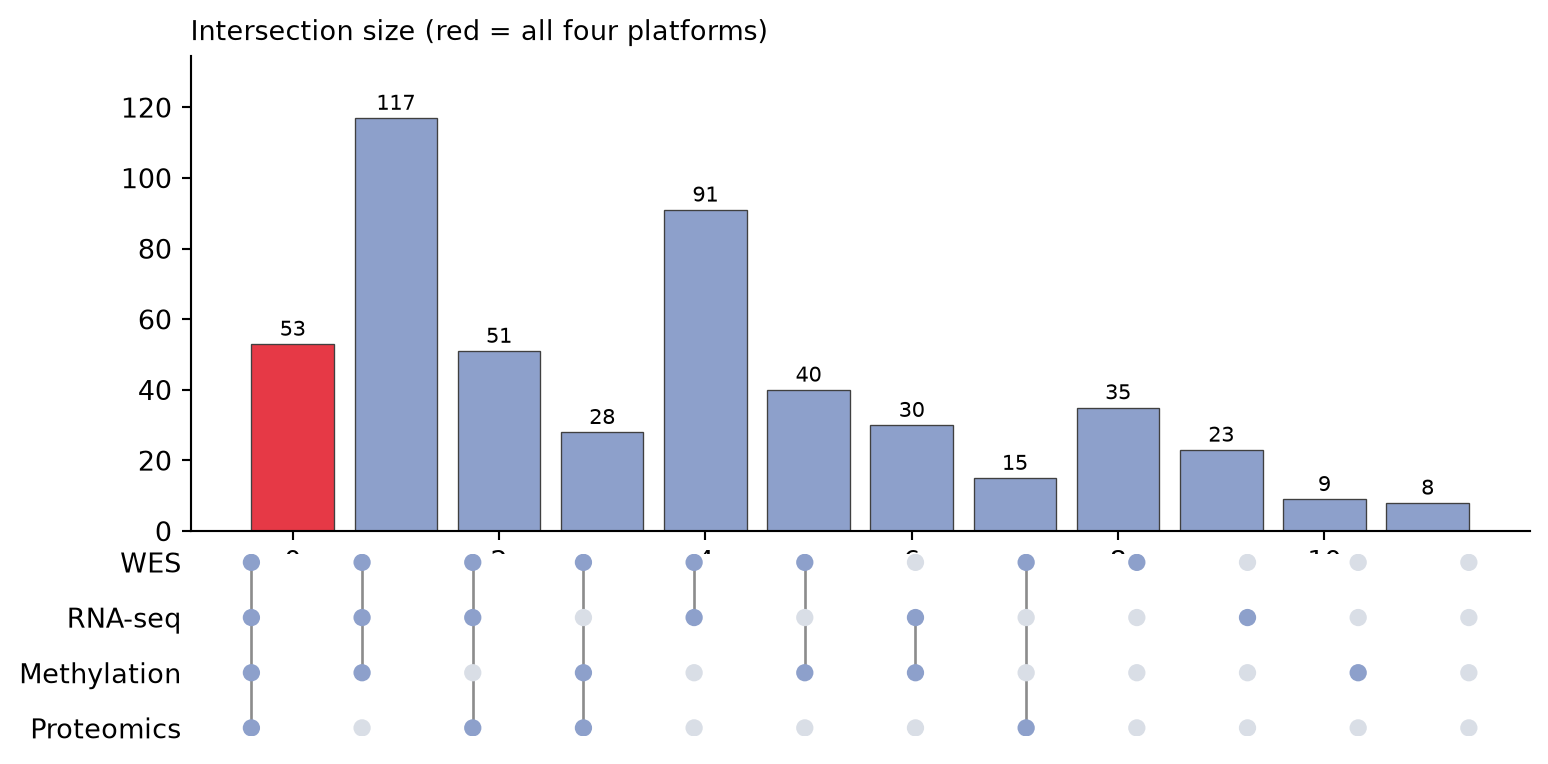
References
- Lex, A., Gehlenborg, N., Strobelt, H., Vuillemot, R., & Pfister, H. (2014). UpSet: Visualization of Intersecting Sets. IEEE Transactions on Visualization and Computer Graphics, 20(12), 1983-1992.
- Hunter, J. D. (2007). Matplotlib: A 2D graphics environment. Computing in Science & Engineering, 9(3), 90-95.