import matplotlib.pyplot as plt
import seaborn as sns
import pandas as pd
import numpy as npBox Plot (Python)
A box plot summarizes the distribution of a numeric variable through its median, quartiles, and outliers. In biomedical research, box plots are the standard compact display for comparing biomarker levels across genotypes, batches, or treatment arms. Python’s seaborn builds directly on matplotlib to provide notched, grouped, and point-overlay variants suitable for publication figures.
Example
Setup
- System Requirements: Cross-platform (Linux/MacOS/Windows)
- Programming Language: Python
- Dependencies:
matplotlib,seaborn,pandas,numpy
Data Preparation
We simulate a serum biomarker assay across three genotypes (WT, HET, KO), with a sex factor for the grouped variant and enough replicates (n = 60 per genotype) for stable quartile estimates.
np.random.seed(7)

genotypes = ['WT', 'HET', 'KO']
n_per_genotype = 60
df = pd.DataFrame({
    'Genotype': np.repeat(genotypes, n_per_genotype),
    'Sex': np.tile(np.repeat(['Female', 'Male'], n_per_genotype // 2), 3),
    'Biomarker': np.concatenate([
        np.random.lognormal(1.2, 0.45, n_per_genotype),
        np.random.lognormal(1.55, 0.45, n_per_genotype),
        np.random.lognormal(1.95, 0.55, n_per_genotype),
    ])
})
# Inject a few extreme values in KO to demonstrate outlier display
df.loc[df.index[-3:], 'Biomarker'] *= 3.5
Visualization
Basic Box Plot
The box spans the interquartile range (IQR), the line marks the median, and whiskers extend to 1.5 × IQR; points beyond are drawn as fliers (outliers).
plt.figure(figsize=(5.5, 4.2))
ax = sns.boxplot(data=df, x='Genotype', y='Biomarker',
                 color='#8da0cb', width=0.5, linewidth=1.0,
                 fliersize=3, flierprops=dict(markerfacecolor='0.4'))
ax.set_xlabel('Genotype')
ax.set_ylabel('Biomarker level (ng/mL)')
ax.spines[['top', 'right']].set_visible(False)
plt.tight_layout()
plt.show()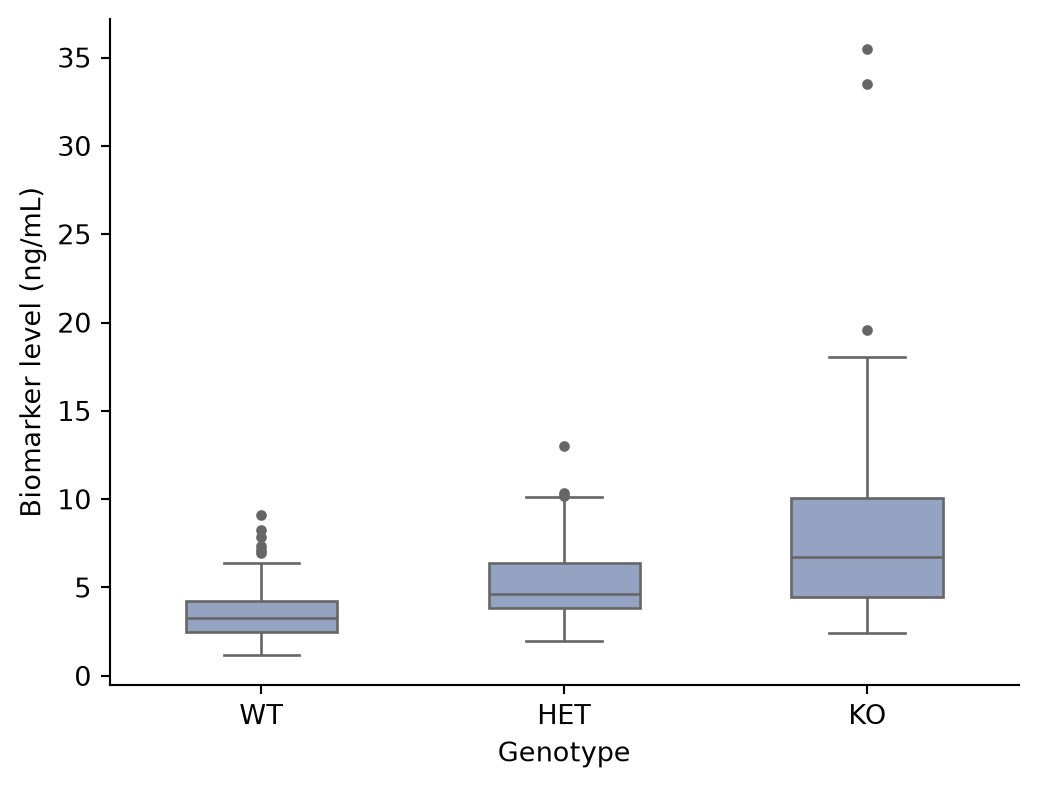
Box Plot with Jittered Points
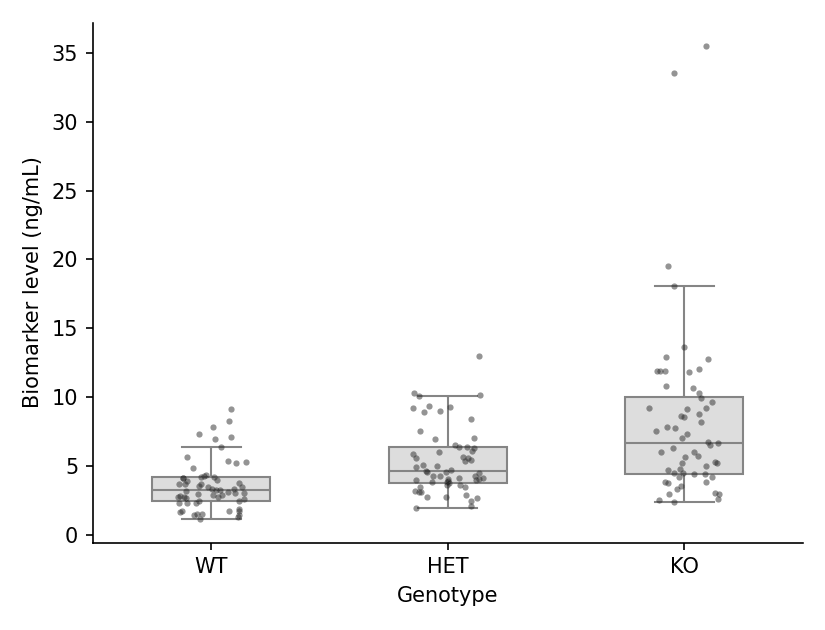
Because a box hides the raw data, overlaying the individual observations is the publication-recommended style: set showfliers=False and add a stripplot layer.
plt.figure(figsize=(5.5, 4.2))
ax = sns.boxplot(data=df, x='Genotype', y='Biomarker',
                 color='#dddddd', width=0.5, linewidth=1.0,
                 showfliers=False)
sns.stripplot(data=df, x='Genotype', y='Biomarker',
              color='#2b2b2b', size=3, alpha=0.5, jitter=0.15, ax=ax)
ax.set_xlabel('Genotype')
ax.set_ylabel('Biomarker level (ng/mL)')
ax.spines[['top', 'right']].set_visible(False)
plt.tight_layout()
plt.show()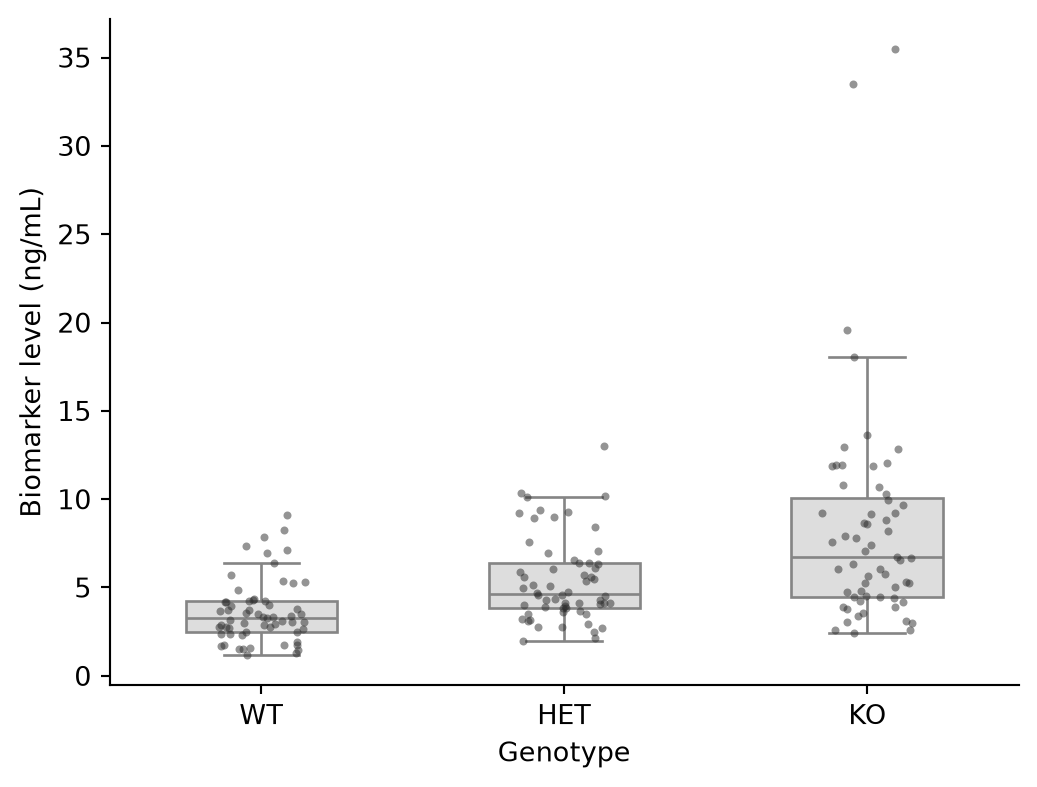
Grouped Box Plot
A second factor is mapped to hue, producing paired boxes within each category — the typical pre/post or two-cohort comparison.
plt.figure(figsize=(6.5, 4.2))
ax = sns.boxplot(data=df, x='Genotype', y='Biomarker', hue='Sex',
                 palette={'Female': '#e78ac3', 'Male': '#8da0cb'},
                 width=0.6, linewidth=1.0, fliersize=2.5)
ax.set_xlabel('Genotype')
ax.set_ylabel('Biomarker level (ng/mL)')
ax.legend(frameon=False, title=None)
ax.spines[['top', 'right']].set_visible(False)
plt.tight_layout()
plt.show()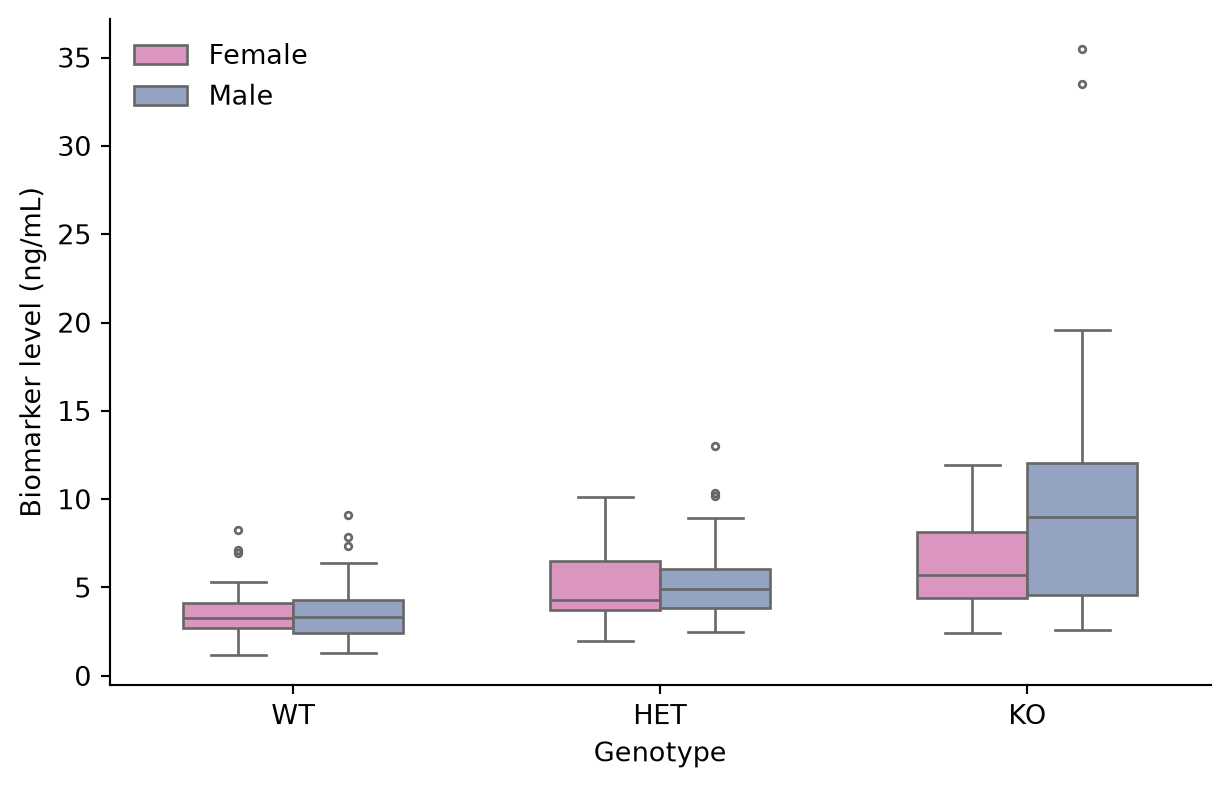
Notched Box Plot
The notch approximates a 95% confidence interval around the median; non-overlapping notches between two boxes are informal evidence of different medians.
plt.figure(figsize=(5.5, 4.2))
ax = sns.boxplot(data=df, x='Genotype', y='Biomarker',
                 color='#a6d854', width=0.5, linewidth=1.0,
                 notch=True, fliersize=3)
ax.set_xlabel('Genotype')
ax.set_ylabel('Biomarker level (ng/mL)')
ax.spines[['top', 'right']].set_visible(False)
plt.tight_layout()
plt.show()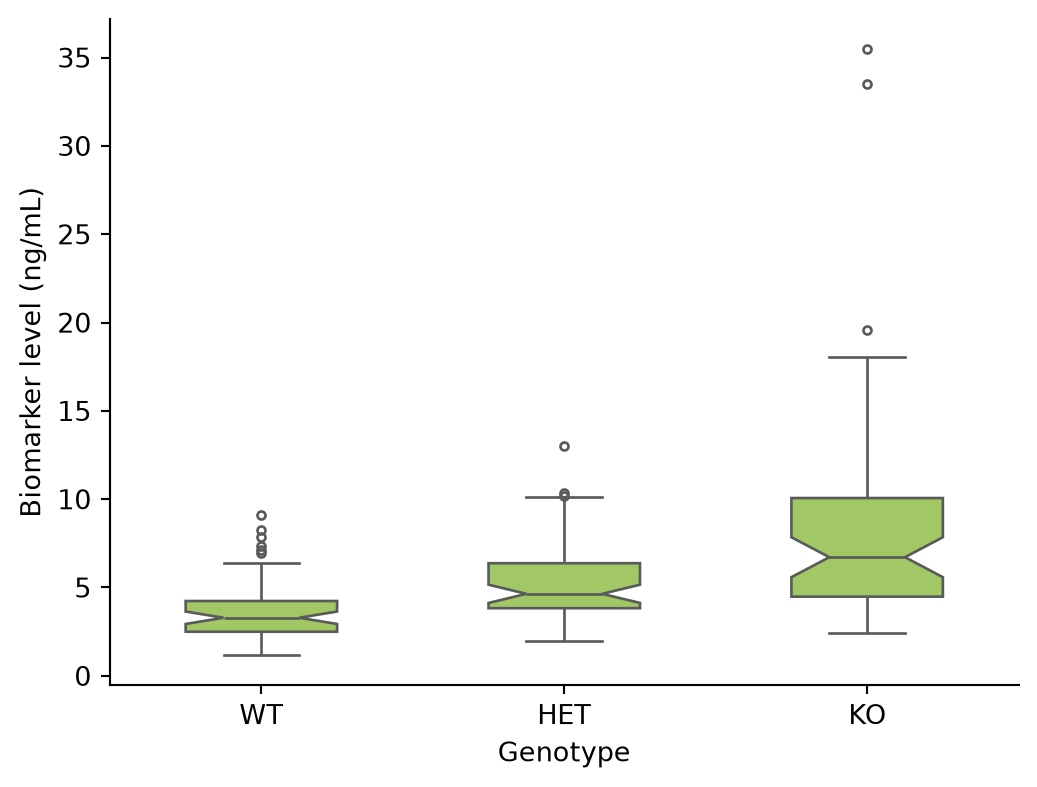
References
- Hunter, J. D. (2007). Matplotlib: A 2D graphics environment. Computing in Science & Engineering, 9(3), 90-95.
- Waskom, M. L. (2021). seaborn: statistical data visualization. Journal of Open Source Software, 6(60), 3021.
- Spitzer, M., Wildenhain, J., Rappsilber, J., & Tyers, M. (2014). BoxPlotR: a web tool for generation of box plots. Nature Methods, 11(2), 121-122.