# Install packages
if (!requireNamespace("data.table", quietly = TRUE)) {
  install.packages("data.table")
}
if (!requireNamespace("jsonlite", quietly = TRUE)) {
  install.packages("jsonlite")
}
if (!requireNamespace("ezcox", quietly = TRUE)) {
  install.packages("ezcox")
}

# Load packages
library(data.table)
library(jsonlite)
library(ezcox)Cox Models Forest
Note
Hiplot website
This page is the tutorial for source code version of the Hiplot Cox Models Forest plugin. You can also use the Hiplot website to achieve no code ploting. For more information please see the following link:
Cox model forest is a visual representation of a COX model that constructs a risk forest map to facilitate variable screening.
Setup
System Requirements: Cross-platform (Linux/MacOS/Windows)
Programming language: R
Dependent packages:
data.table;jsonlite;ezcox
sessioninfo::session_info("attached")─ Session info ───────────────────────────────────────────────────────────────
setting value
version R version 4.6.0 (2026-04-24)
os Ubuntu 24.04.4 LTS
system x86_64, linux-gnu
ui X11
language (EN)
collate C.UTF-8
ctype C.UTF-8
tz UTC
date 2026-05-09
pandoc 3.1.3 @ /usr/bin/ (via rmarkdown)
quarto 1.9.37 @ /usr/local/bin/quarto
─ Packages ───────────────────────────────────────────────────────────────────
package * version date (UTC) lib source
data.table * 1.18.4 2026-05-06 [1] RSPM
ezcox * 1.0.4 2023-05-08 [1] RSPM
jsonlite * 2.0.0 2025-03-27 [1] RSPM
[1] /home/runner/work/_temp/Library
[2] /opt/R/4.6.0/lib/R/site-library
[3] /opt/R/4.6.0/lib/R/library
* ── Packages attached to the search path.
──────────────────────────────────────────────────────────────────────────────Data Preparation
The loaded data are time,status and multiple variable factor.
# Load data
data <- data.table::fread(jsonlite::read_json("https://hiplot.cn/ui/basic/ezcox/data.json")$exampleData$textarea[[1]])
data <- as.data.frame(data)

# View data
head(data)
time status sex ph.ecog age
1 306 2 1 1 74
2 455 2 1 0 68
3 1010 1 1 0 56
4 210 2 1 1 57
5 883 2 1 0 60
6 1022 1 1 1 74Visualization
# Cox Models Forest
p <- show_forest(
  data = data,
  covariates = c("sex", "ph.ecog"),
  controls = "age",
  merge_models = F,
  drop_controls = F,
  add_caption = T
)

p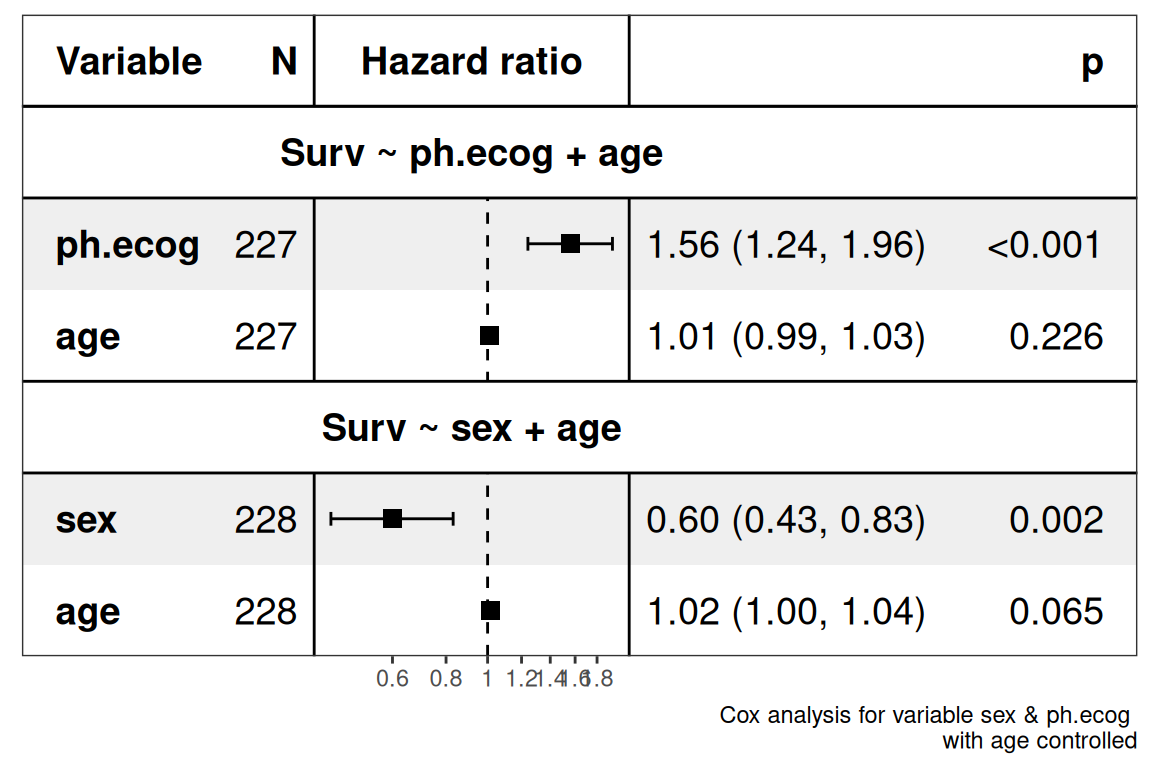
The first column of the table shows the variables and sample numbers, the second column shows the forest plot, and the third column shows the CI 95% confidence interval range, its mean and P values.
Forest map interpretation.
The middle vertical line represents the invalid line, the horizontal line represents the 95% confidence interval of the variable factor, and the length represents the magnitude of the confidence interval. If the confidence interval of a variable factor intersects the invalid line, the variable factor is considered to have no statistical significance, and the position of the square is the point estimation of HR.
Age is the control variable.
The incidence of the ph.ecog factor is greater than that of the age factor, and the ph.ecog factor increases the occurrence of survival (P<0.001, statistically significant).
The incidence of sex is less than that of age, and sex reduces the incidence of survival (P =0.002<0.05, statistically significant).