import matplotlib.pyplot as plt
import numpy as np
from collections import Counter
from wordcloud import WordCloud, STOPWORDS词云图 (Python)
词云图的 Python 对应版本——词云图按词频缩放词语大小,一眼呈现语料的词汇概况:会议议题、患者报告症状、PubMed 检索式的索引词。它是探索性展示而非测量工具——精确比较请使用频率表或条形图。
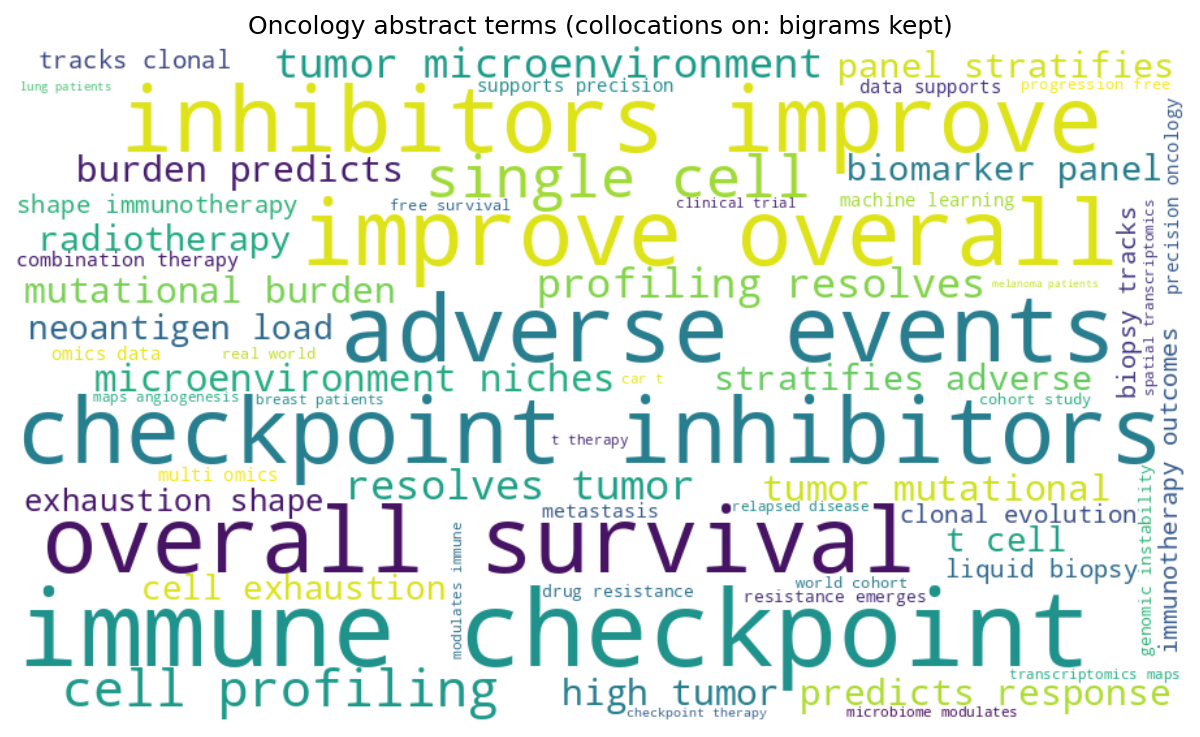
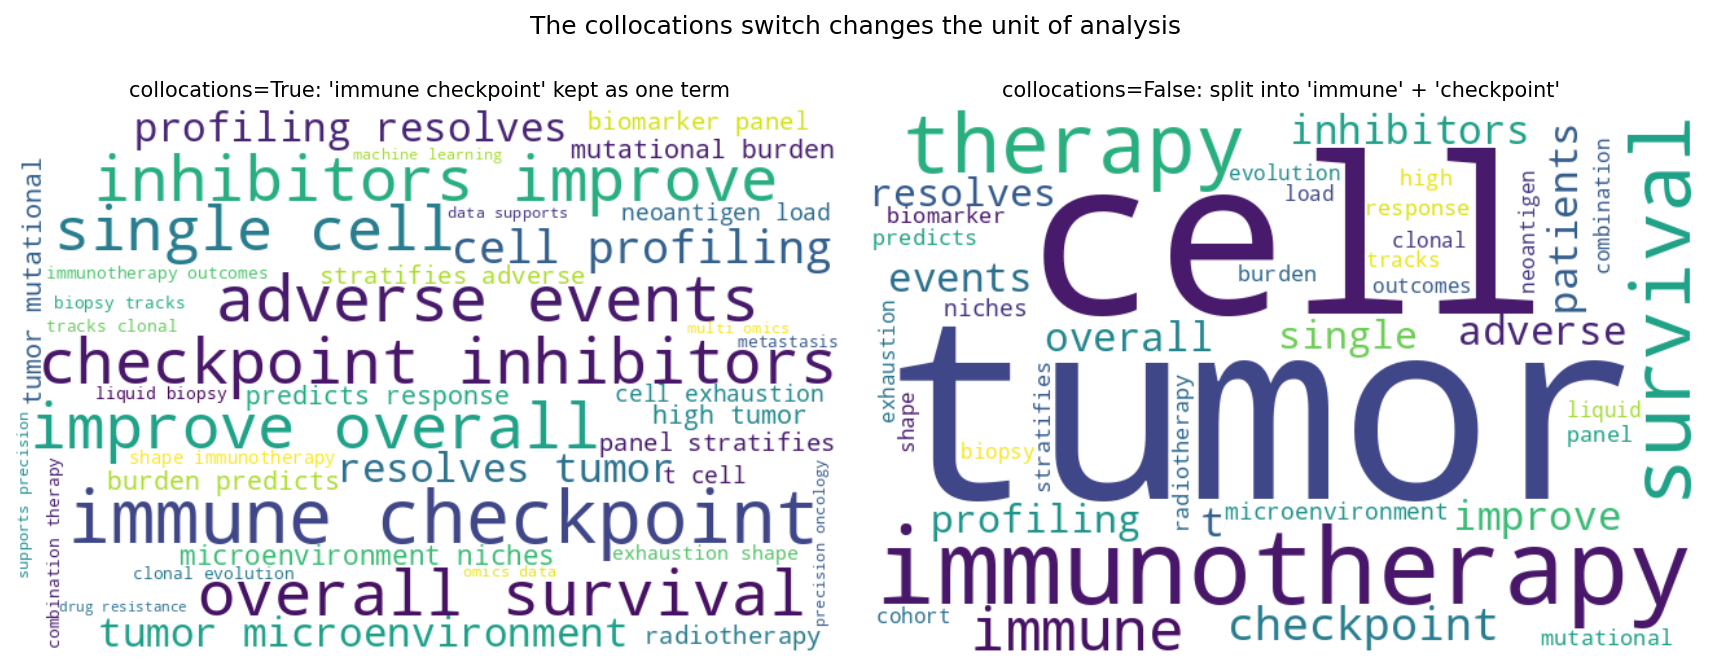
wordcloud 包负责布局 [1]。两个设置决定结果:collocations(相邻词对如 “immune checkpoint” 是否作为一个词保留)与输入模式(自由文本 vs 预计算频率字典)。两者都会改变分析单元,因此必须在图注中说明。
本教程涵盖两种工作流:
- 保留搭配(二元组)的文本驱动词云;
- 使用印刷友好的顺序调色板的频率驱动词云。
Example
Setup
- 系统要求:跨平台(Linux/MacOS/Windows)
- 编程语言:Python
- 依赖包:
matplotlib、numpy、wordcloud
Data Preparation
我们用肿瘤学摘要句子组装伪语料,按固定权重抽样 600 次,使主题分布可复现。词频同时被直接统计(去除停用词)供频率驱动变体使用。中文文本需先用 jieba 分词,再传入词表或频率字典——否则 wordcloud 只按空格切分。
rng = np.random.default_rng(13)
templates = [
    "immune checkpoint inhibitors improve overall survival in {d} patients",
    "high tumor mutational burden predicts response to immunotherapy",
    "single-cell profiling resolves tumor microenvironment niches",
    "liquid biopsy tracks clonal evolution during combination therapy",
    "a biomarker panel stratifies adverse events after radiotherapy",
    "neoantigen load and t cell exhaustion shape immunotherapy outcomes",
    "spatial transcriptomics maps angiogenesis in metastasis",
    "machine learning on multi-omics data supports precision oncology",
    "drug resistance emerges through genomic instability",
    "a real world cohort study of progression-free survival",
    "the microbiome modulates immune checkpoint therapy",
    "car-t therapy in relapsed disease: a clinical trial",
    "chronic inflammation accelerates tumor growth and metastasis",
    "quality of life and adverse events in elderly cohorts",
    "pathology review confirmed tumor suppressor loss",
]
weights = np.array([8, 7, 7, 6, 6, 5, 4, 5, 4, 4, 3, 3, 3, 2, 2], float)
picks = rng.choice(len(templates), size=600, p=weights / weights.sum())
text = " ".join(
    templates[i].format(d=rng.choice(["melanoma", "lung", "breast"]))
    for i in picks)

terms = Counter()
for i in picks:
    for tok in templates[i].replace("{d}", "patients").split():
        if tok.lower() not in STOPWORDS and tok.isalpha():
            terms[tok.lower()] += 1
freq = dict(terms)
Visualization
1. 保留搭配的文本驱动词云
wc = WordCloud(width=900, height=520, background_color="white",
               colormap="viridis", stopwords=STOPWORDS,
               collocations=True, random_state=7, max_words=60)
wc = wc.generate_from_text(text)
fig, ax = plt.subplots(figsize=(8.5, 5))
ax.imshow(wc, interpolation="bilinear")
ax.axis("off")
ax.set_title("Oncology abstract terms (collocations on: bigrams kept)")
fig.tight_layout()
plt.show()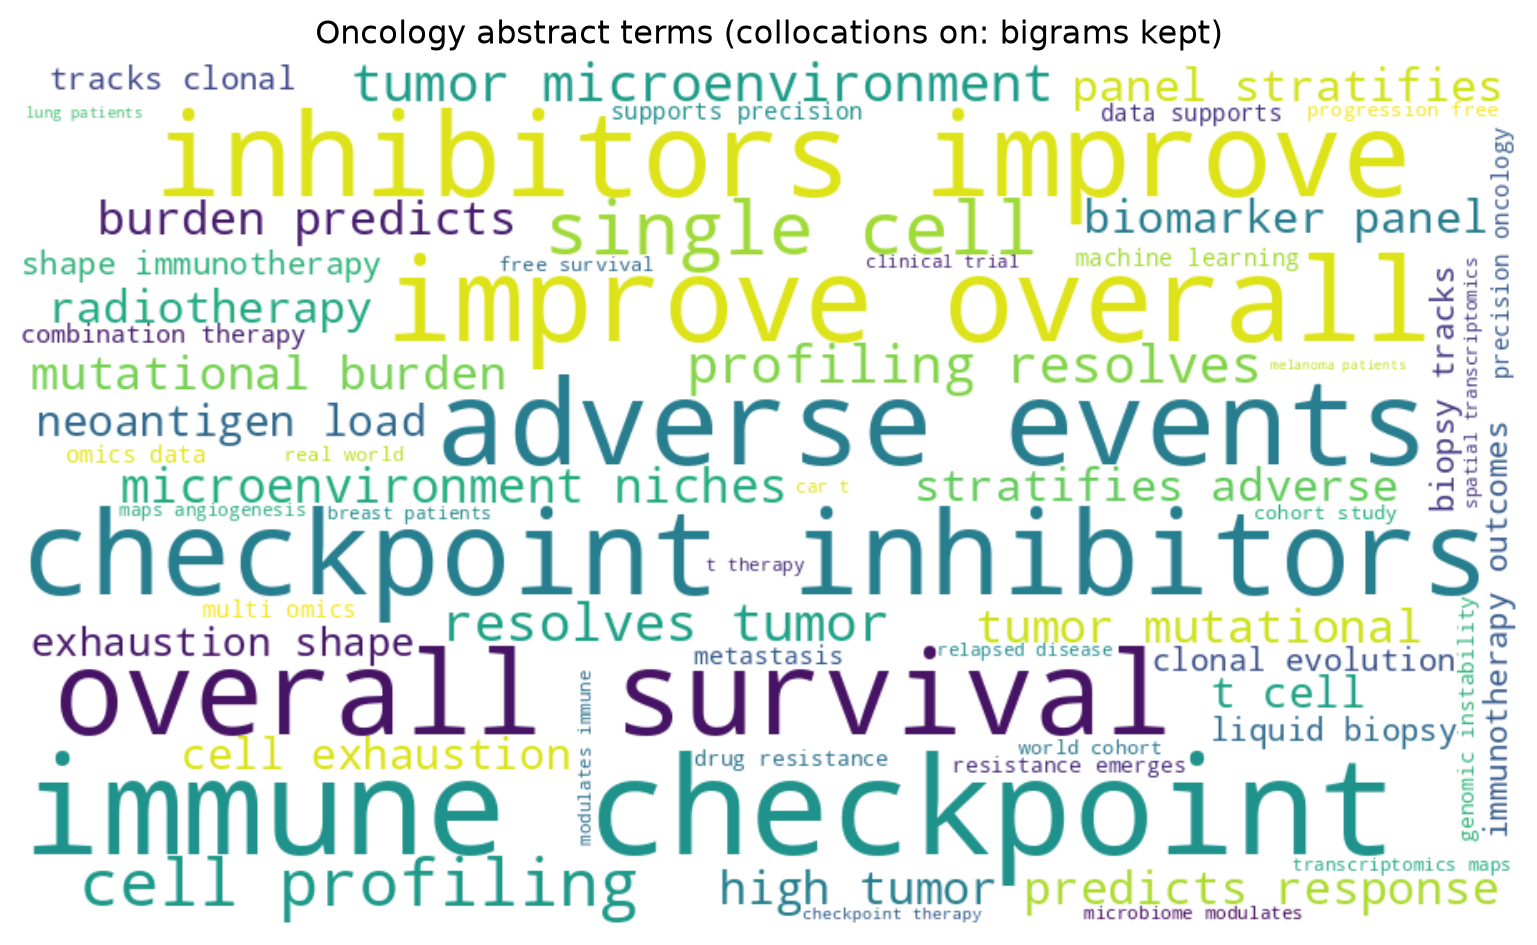
2. 面向印刷的频率驱动词云
from matplotlib.colors import to_hex
blues = plt.get_cmap("Blues")(np.linspace(0.45, 0.95, 256))

def print_blues(*args, **kwargs):
    return to_hex(blues[rng.integers(0, len(blues))])

wc2 = WordCloud(width=900, height=520, background_color="white",
                random_state=7, max_words=25)
wc2.generate_from_frequencies(freq)
wc2.recolor(color_func=print_blues)
fig, ax = plt.subplots(figsize=(8.5, 5))
ax.imshow(wc2, interpolation="bilinear")
ax.axis("off")
ax.set_title("Top-25 terms from frequencies (sequential palette for print)")
fig.tight_layout()
plt.show()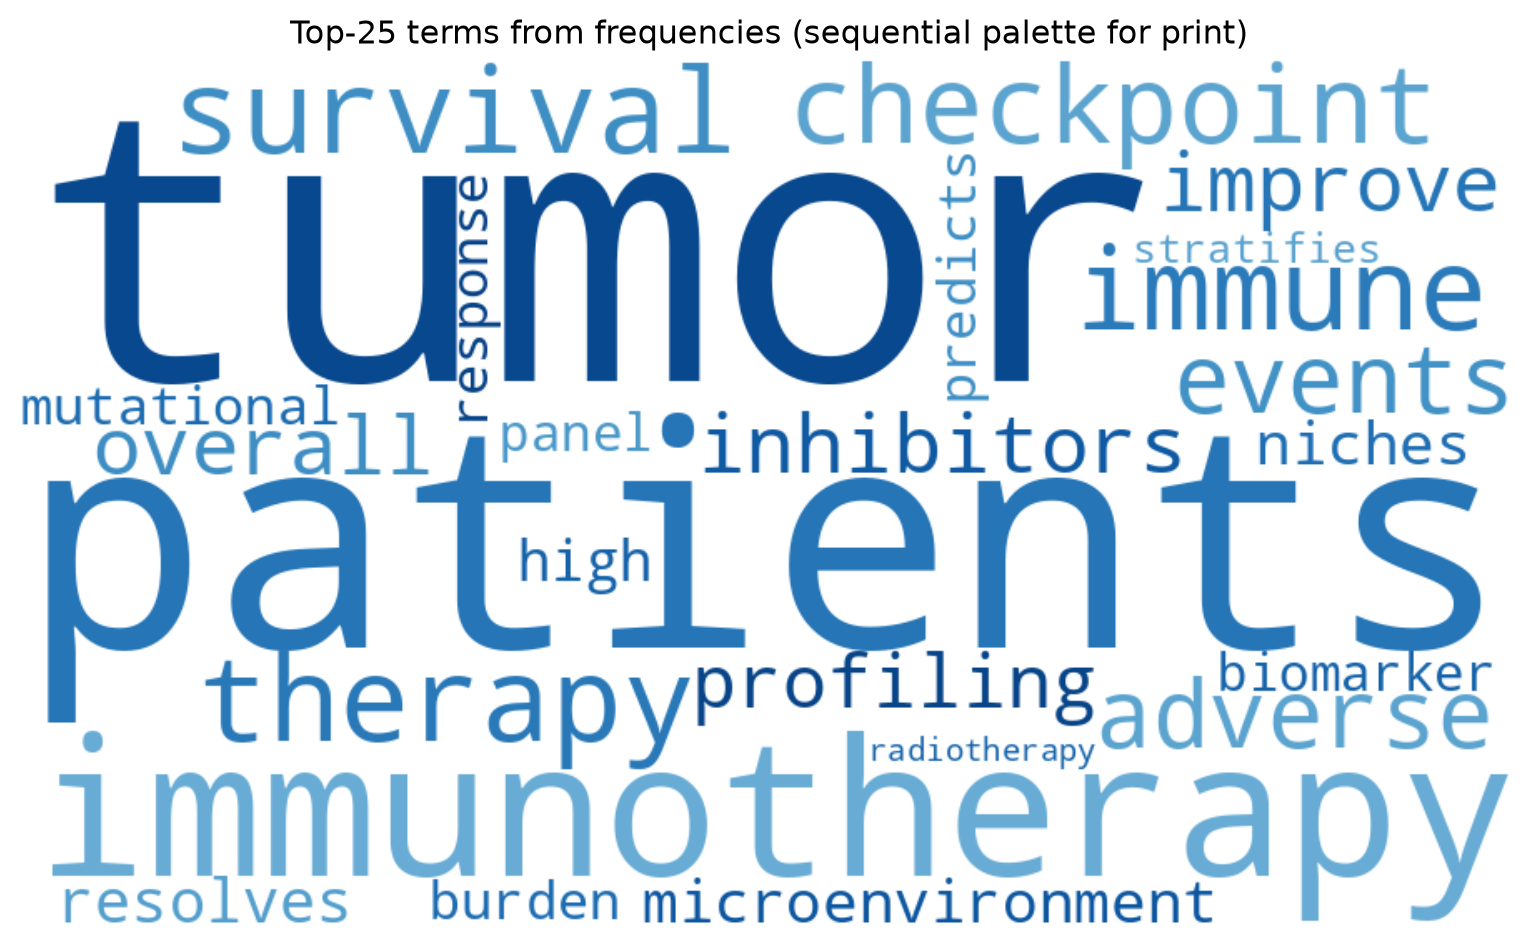
提示实践要点
- 始终传入
random_state=——词的摆放是随机的,不给种子则每次重跑形状都不同。 - 搭配开关要有意识地选择:
True保留多词概念,False按单词计数;同一对比的多张图绝不能混用两种模式。 - 绘制前移除领域停用词(patient、study、result),否则它们会凭语法频率霸占画面。
- 词的面积只是近似编码词频(布局装箱会扰动它);分析请配合精确计数的表格。
- 中文语料先用
jieba分词再传频率;默认的空白分词无法切分中文。
Application
搭配开关是最常被误用的设置:True 时语料保留 “immune checkpoint” 这一概念;False 时同一语料被拆成 “immune” 与 “checkpoint”,两者的表观频率都翻倍。当分析单元影响结论时,把两种词云并排展示。
Reference
[1] Müller A. wordcloud: generate word clouds in Python. 2024. https://github.com/amueller/word_cloud