if (!requireNamespace("ggplot2", quietly = TRUE)) install.packages("ggplot2")
if (!requireNamespace("dplyr", quietly = TRUE)) install.packages("dplyr")
if (!requireNamespace("scales", quietly = TRUE)) install.packages("scales")

library(ggplot2)
library(dplyr)
library(scales)Immune-Related LncRNA Identification
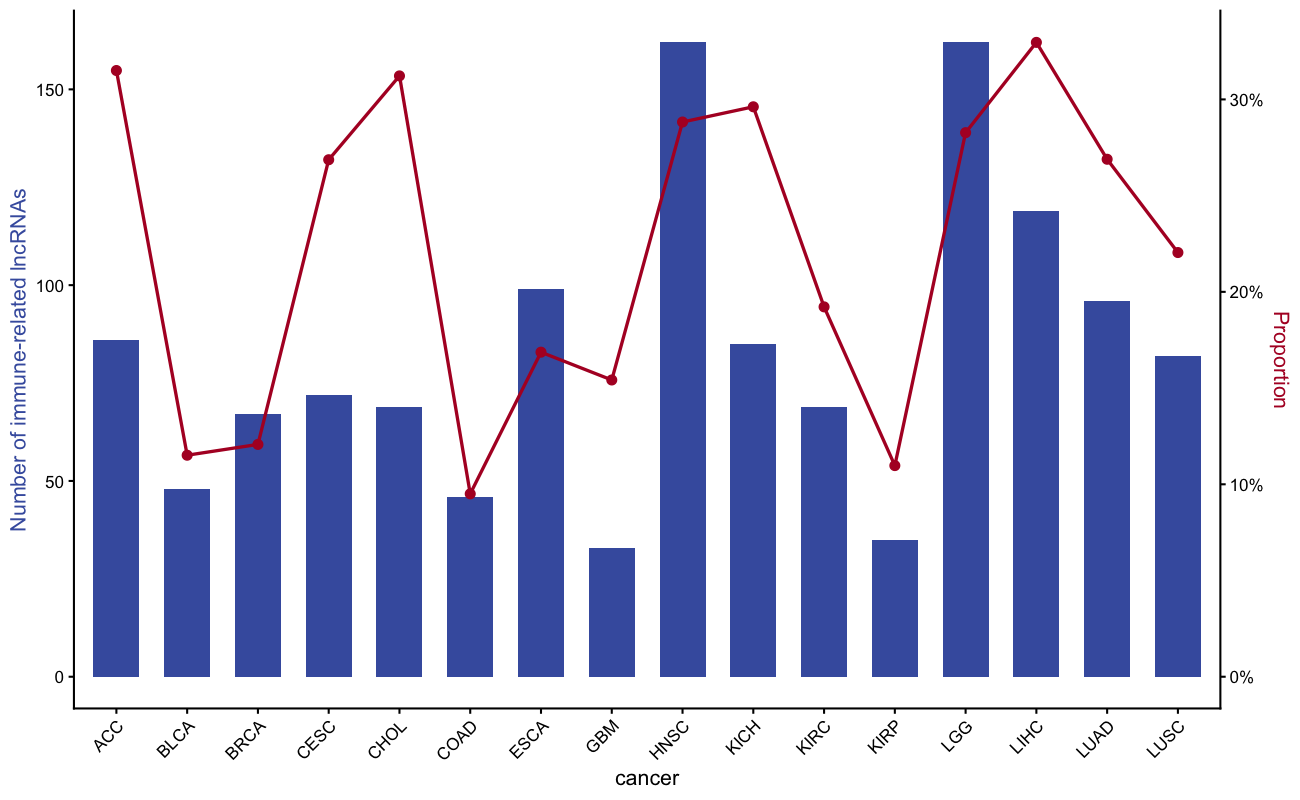
Identifying immune-related lncRNAs uses partial correlation between lncRNA expression and immune gene sets, followed by GSEA [1]. The canonical figure is a dual-axis bar + line chart: bars show the number of immune-related lncRNAs per cancer type (top y-axis) while a line shows the proportion (bottom y-axis).
Example
Setup
System Requirements: Cross-platform (Linux/MacOS/Windows)
Programming Language: R
Dependent packages:
ggplot2;dplyr;scales
sessioninfo::session_info("attached")─ Session info ───────────────────────────────────────────────────────────────
setting value
version R version 4.6.2 (2026-10-29)
os Ubuntu 26.04.1 LTS
system x86_64, linux-gnu
ui X11
language (EN)
collate C.UTF-8
ctype C.UTF-8
tz UTC
date 2026-11-05
pandoc 3.7.0.2 @ /usr/bin/ (via rmarkdown)
quarto 1.11.9 @ /usr/local/bin/quarto
─ Packages ───────────────────────────────────────────────────────────────────
! package * version date (UTC) lib source
P dplyr * 1.2.1 2026-04-03 [?] RSPM
P ggplot2 * 4.0.3.9000 2026-11-03 [?] Github (tidyverse/ggplot2@b638d65)
P scales * 1.4.0 2025-04-24 [?] RSPM
[1] /home/runner/.cache/R/renv/library/Bizard-5140bdc6/linux-ubuntu-resolute/R-4.6/x86_64-pc-linux-gnu
[2] /home/runner/work/_temp/Library
[3] /opt/R/4.6.2/lib/R/library
* ── Packages attached to the search path.
P ── Loaded and on-disk path mismatch.
──────────────────────────────────────────────────────────────────────────────Data Preparation
With real data, immune-related lncRNAs are identified per cancer type via the ImmuLncRNA algorithm (partial correlation + GSEA). We simulate the per-cancer-type summary output: the number of immune-related lncRNAs and the total lncRNA count, from which the proportion is derived.
set.seed(1801)
cancers <- c("ACC", "BLCA", "BRCA", "CESC", "CHOL", "COAD", "ESCA", "GBM",
             "HNSC", "KICH", "KIRC", "KIRP", "LGG", "LIHC", "LUAD", "LUSC")
n_lnc_total <- sample(200:600, length(cancers))
n_immune    <- round(n_lnc_total * runif(length(cancers), 0.08, 0.35))

df <- data.frame(cancer = cancers,
                 total = n_lnc_total,
                 immune = n_immune) |>
  mutate(prop = immune / total)
head(df)
cancer total immune prop
1 ACC 273 86 0.31501832
2 BLCA 417 48 0.11510791
3 BRCA 555 67 0.12072072
4 CESC 268 72 0.26865672
5 CHOL 221 69 0.31221719
6 COAD 484 46 0.09504132Visualization
1. Dual-Axis Bar + Line Chart
max_count <- max(df$immune)
max_prop  <- max(df$prop)

ggplot(df, aes(cancer, immune)) +
  geom_col(fill = "#445EAD", width = 0.65) +
  geom_line(aes(cancer, prop * max_count / max_prop, group = 1),
            colour = "#B2182B", linewidth = 0.8) +
  geom_point(aes(cancer, prop * max_count / max_prop),
             colour = "#B2182B", size = 2) +
  scale_y_continuous(
    name = "Number of immune-related lncRNAs",
    sec.axis = sec_axis(~ . * max_prop / max_count,
                        name = "Proportion",
                        labels = percent)) +
    labs(title = "Immune-related lncRNAs across cancer types") +
  theme_classic(base_size = 11) +
  theme(axis.text.x = element_text(angle = 45, hjust = 1),
        axis.title.y.left = element_text(colour = "#445EAD"),
        axis.title.y.right = element_text(colour = "#B2182B"))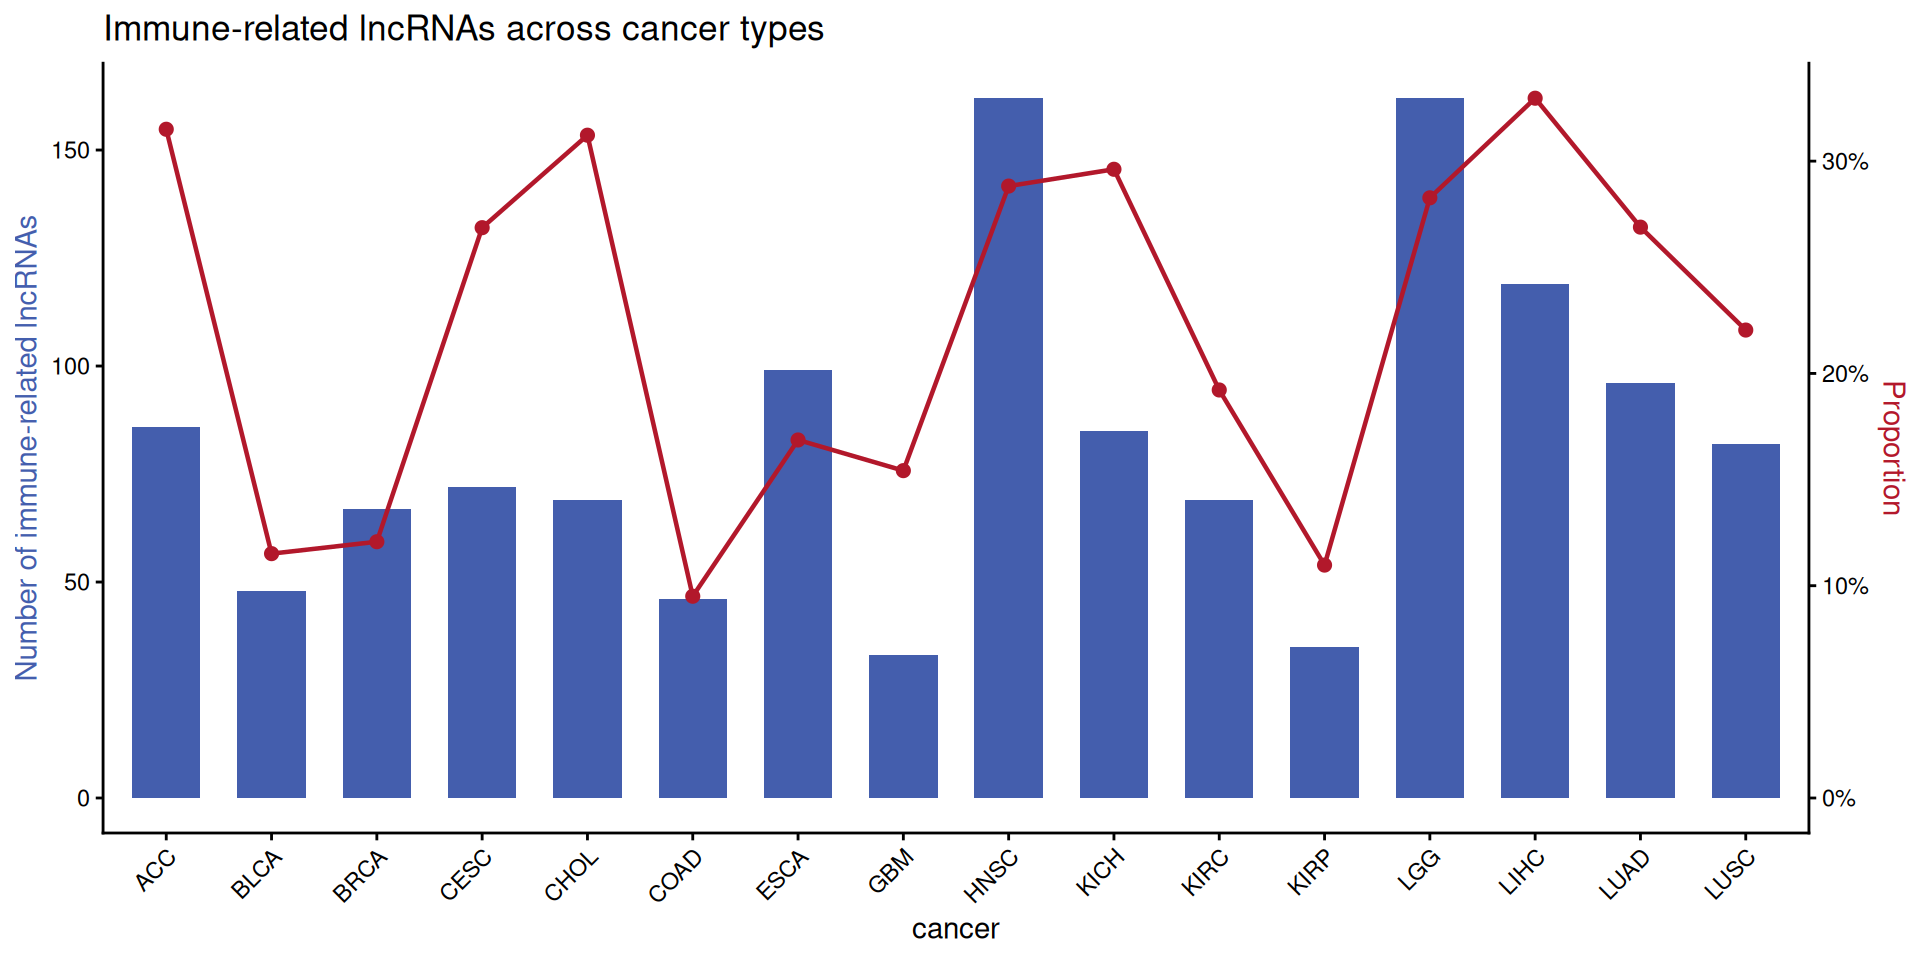
Tip
Practice tips
- The scaling factor
max_count / max_propaligns the two y-axes so the line sits within the bar range; adjust to avoid visual clutter. - Colour-code the two y-axis titles to match the bar and line colours — readers instinctively match axis title colour to the corresponding layer.
- The reference workflow uses the ImmuLncRNA package (partial correlation + GSEA); the dual-axis chart is the summary visualisation of its output.
Application
Immune-related lncRNA identification is the first step in immune-lncRNA biomarker studies; the dual-axis chart compares yield across cancer types.
Reference
[1] Xiaofan Lu, et al. FigureYa: A Standardized Visualization Framework for Enhancing Biomedical Data Interpretation and Research Efficiency. iMetaMed. 2025. doi:10.1002/imm3.70005