using CairoMakie
using AlgebraOfGraphics
using DataFrames
using Statistics
using RandomFaceted Plots (Julia)
Faceting splits one dataset into a grid of panels by categorical variables, holding every panel on identical axes so group differences read as shape differences. In Julia the grammar-of-graphics layer AlgebraOfGraphics composes faceted specifications from a mapping — the closest Julia equivalent to ggplot faceting or seaborn’s relplot.
Example
Setup
- System Requirements: Cross-platform (Linux/MacOS/Windows)
- Programming Language: Julia
- Dependencies:
CairoMakie,AlgebraOfGraphics,DataFrames,Statistics
Data Preparation
We simulate a longitudinal treatment study in long format — 4 genotypes × 2 arms × 6 weekly measurements — one row per observation, the shape AlgebraOfGraphics expects.
Random.seed!(201)

genotypes = ["WT", "HET", "KO", "RES"]
rates = Dict(g => 0.10 + 0.08 * (3 - i) for (i, g) in enumerate(genotypes))
rows = []
for geno in genotypes
    for arm in ["Vehicle", "Treatment"]
        rate = rates[geno] + (arm == "Treatment" ? 0.0 : -0.05)
        for mouse in 1:8, week in 0:5
            push!(rows, (Genotype = geno, Arm = arm, Week = week,
                         Score = 1 + 2.4 * rate * week / 5 + 0.12 * randn()))
        end
    end
end
long = DataFrame(rows)
384×4 DataFrame
359 rows omitted
| Row | Genotype | Arm | Week | Score |
|---|---|---|---|---|
| String | String | Int64 | Float64 | |
| 1 | WT | Vehicle | 0 | 0.996337 |
| 2 | WT | Vehicle | 1 | 1.09882 |
| 3 | WT | Vehicle | 2 | 1.30855 |
| 4 | WT | Vehicle | 3 | 1.17022 |
| 5 | WT | Vehicle | 4 | 1.34779 |
| 6 | WT | Vehicle | 5 | 1.55968 |
| 7 | WT | Vehicle | 0 | 1.15025 |
| 8 | WT | Vehicle | 1 | 1.13707 |
| 9 | WT | Vehicle | 2 | 1.11064 |
| 10 | WT | Vehicle | 3 | 1.38315 |
| 11 | WT | Vehicle | 4 | 1.42207 |
| 12 | WT | Vehicle | 5 | 1.76371 |
| 13 | WT | Vehicle | 0 | 1.11001 |
| ⋮ | ⋮ | ⋮ | ⋮ | ⋮ |
| 373 | RES | Treatment | 0 | 1.18669 |
| 374 | RES | Treatment | 1 | 0.97793 |
| 375 | RES | Treatment | 2 | 1.11329 |
| 376 | RES | Treatment | 3 | 0.927396 |
| 377 | RES | Treatment | 4 | 0.995892 |
| 378 | RES | Treatment | 5 | 0.856548 |
| 379 | RES | Treatment | 0 | 1.15491 |
| 380 | RES | Treatment | 1 | 0.97661 |
| 381 | RES | Treatment | 2 | 1.25163 |
| 382 | RES | Treatment | 3 | 1.17638 |
| 383 | RES | Treatment | 4 | 1.04982 |
| 384 | RES | Treatment | 5 | 0.966681 |
Visualization
Faceted Trajectories
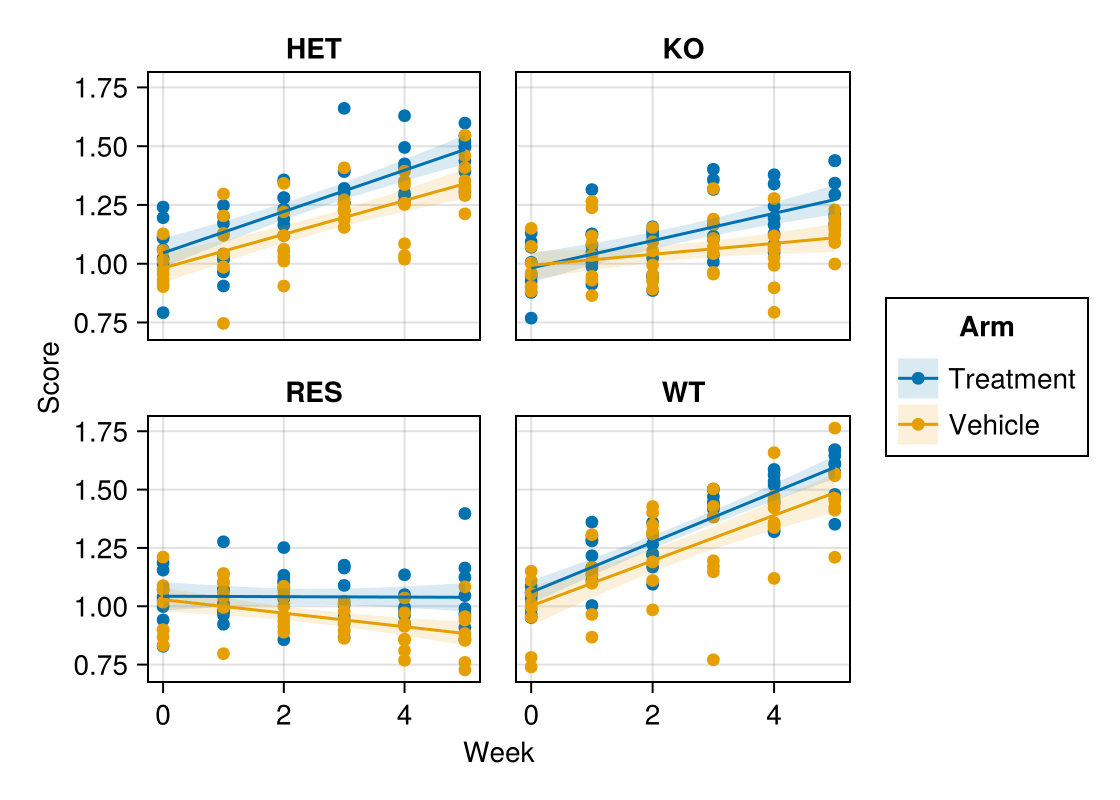
mapping carries the aesthetic assignment (layout facets the grid); combining with a smoothed visual line layer builds the panel in one pipeline.
spec = data(long) * mapping(:Week, :Score, color = :Arm,
                            layout = :Genotype) *
       visual(Scatter) +
       data(long) * mapping(:Week, :Score, color = :Arm,
                            layout = :Genotype) * linear()

fg = draw(spec; figure = (size = (560, 400),))
fg
Distribution Facets
The same grammar swaps layers for a histogram + density analysis; mapping decides what, the analysis decides how.
final = long[long.Week .== 5, :]

hist_spec = data(final) * mapping(:Score, layout = :Genotype, color = :Genotype) *
            histogram(bins = 14) +
            data(final) * mapping(:Score, layout = :Genotype, color = :Genotype) *
            AlgebraOfGraphics.density()

fg = draw(hist_spec; figure = (size = (560, 380),))
fg
References
- AlgebraOfGraphics development team. AlgebraOfGraphics.jl documentation. https://aog.makie.org/
- Danisch, S., & Krumbiegel, J. (2021). Makie.jl: Flexible high-performance data visualization for Julia. Journal of Open Source Software, 6(65), 3349.