# Installing necessary packages
if (!requireNamespace("scRNAtoolVis", quietly = TRUE)) {
  remotes::install_github('junjunlab/scRNAtoolVis')
}
if (!requireNamespace("corrplot", quietly = TRUE)) {
  install.packages("corrplot")
}

# Load packages
library(scRNAtoolVis)
library(corrplot)Multiple Volcano Plot
Multiple Volcano Plot is a graph used for differential expression analysis of high-throughput data (such as transcriptomes and proteomes). Compared with the traditional volcano plot, the multi-group volcano plot can display the results of multiple groups at the same time, making it easier to compare the consistency or specificity of differential features horizontally.
Example
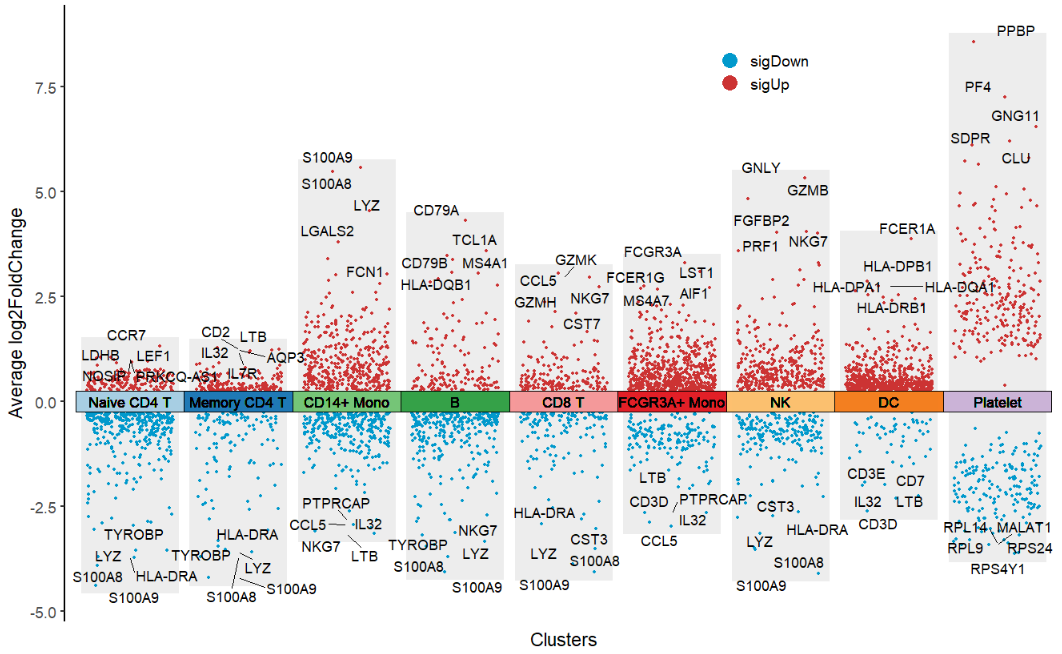
This Multiple Volcano Plot shows the differential gene expression patterns of multiple cell clusters in single-cell sequencing data. The blocks of different colors on the X-axis represent different cell clusters, and the scattered points inside the blocks represent differential genes. The geom_jitter function is used to add a jitter effect to the scattered points to avoid overlapping data points. The Y-axis represents the difference fold (Average log2FoldChange, red scattered points represent up-regulated genes with log2FC>0, blue scattered points represent down-regulated genes with log2FC<0, and the top5 differential genes are marked with text. The multi-group volcano plot not only highlights the specific differential genes of each cell cluster (such as marker genes for specific cell types), but also can intuitively identify the key regulatory molecules shared across cell clusters.
Setup
System Requirements: Cross-platform (Linux/MacOS/Windows)
Programming Language: R
Dependencies:
scRNAtoolVis;corrplot
sessioninfo::session_info("attached")─ Session info ───────────────────────────────────────────────────────────────
setting value
version R version 4.6.0 (2026-04-24)
os Ubuntu 24.04.4 LTS
system x86_64, linux-gnu
ui X11
language (EN)
collate C.UTF-8
ctype C.UTF-8
tz UTC
date 2026-05-09
pandoc 3.1.3 @ /usr/bin/ (via rmarkdown)
quarto 1.9.37 @ /usr/local/bin/quarto
─ Packages ───────────────────────────────────────────────────────────────────
package * version date (UTC) lib source
corrplot * 0.95 2024-10-14 [1] RSPM
dplyr * 1.2.1 2026-04-03 [1] RSPM
forcats * 1.0.1 2025-09-25 [1] RSPM
ggplot2 * 4.0.3.9000 2026-05-04 [1] Github (tidyverse/ggplot2@6870419)
lubridate * 1.9.5 2026-02-04 [1] RSPM
purrr * 1.2.2 2026-04-10 [1] RSPM
readr * 2.2.0 2026-02-19 [1] RSPM
scRNAtoolVis * 0.1.0 2026-05-04 [1] Github (junjunlab/scRNAtoolVis@c99eaa8)
stringr * 1.6.0 2025-11-04 [1] RSPM
tibble * 3.3.1 2026-01-11 [1] RSPM
tidyr * 1.3.2 2025-12-19 [1] RSPM
tidyverse * 2.0.0 2023-02-22 [1] RSPM
[1] /home/runner/work/_temp/Library
[2] /opt/R/4.6.0/lib/R/site-library
[3] /opt/R/4.6.0/lib/R/library
* ── Packages attached to the search path.
──────────────────────────────────────────────────────────────────────────────Data Preparation
The data uses the pbmc.markers single-cell sequencing differentially expressed gene dataset provided by the scRNAtoolVis package.
# Load data
data('pbmc.markers')
# View data
head(pbmc.markers)
p_val avg_log2FC pct.1 pct.2 p_val_adj cluster gene
RPS12 2.008629e-140 0.7256738 1.000 0.991 2.754633e-136 Naive CD4 T RPS12
RPS27 2.624075e-140 0.7242847 0.999 0.992 3.598656e-136 Naive CD4 T RPS27
RPS6 1.280169e-138 0.6742630 1.000 0.995 1.755623e-134 Naive CD4 T RPS6
RPL32 4.358823e-135 0.6121027 0.999 0.995 5.977689e-131 Naive CD4 T RPL32
RPS14 3.618793e-128 0.6179756 1.000 0.994 4.962812e-124 Naive CD4 T RPS14
CYBA 1.090337e-124 -1.5739355 0.661 0.914 1.495288e-120 Naive CD4 T CYBANote: The dataset should include at least the following five columns: p_val, avg_log2FC, p_val_adj, cluster, and gene. The column names cannot be changed, but the order of the columns can be changed. The names of the grouping blocks shown in the plot are the names in the cluster column content.
Visualization
1. Basic Plot
Multiple volcano plots can be drawn using the jjVolcano function provided in the scRNAtoolVis package.
# Basic Multiple Volcano Plot
p <- jjVolcano(
  diffData = pbmc.markers,
  topGeneN = 5,
  log2FC.cutoff = 0.5,
  col.type = "updown",
  aesCol = c('#0099CC','#CC3333'),
  tile.col = corrplot::COL2('PuOr', 15)[4:12],
  cluster.order = rev(unique(pbmc.markers$cluster)),
  size  = 3.5,
  fontface = 'italic'
  )

p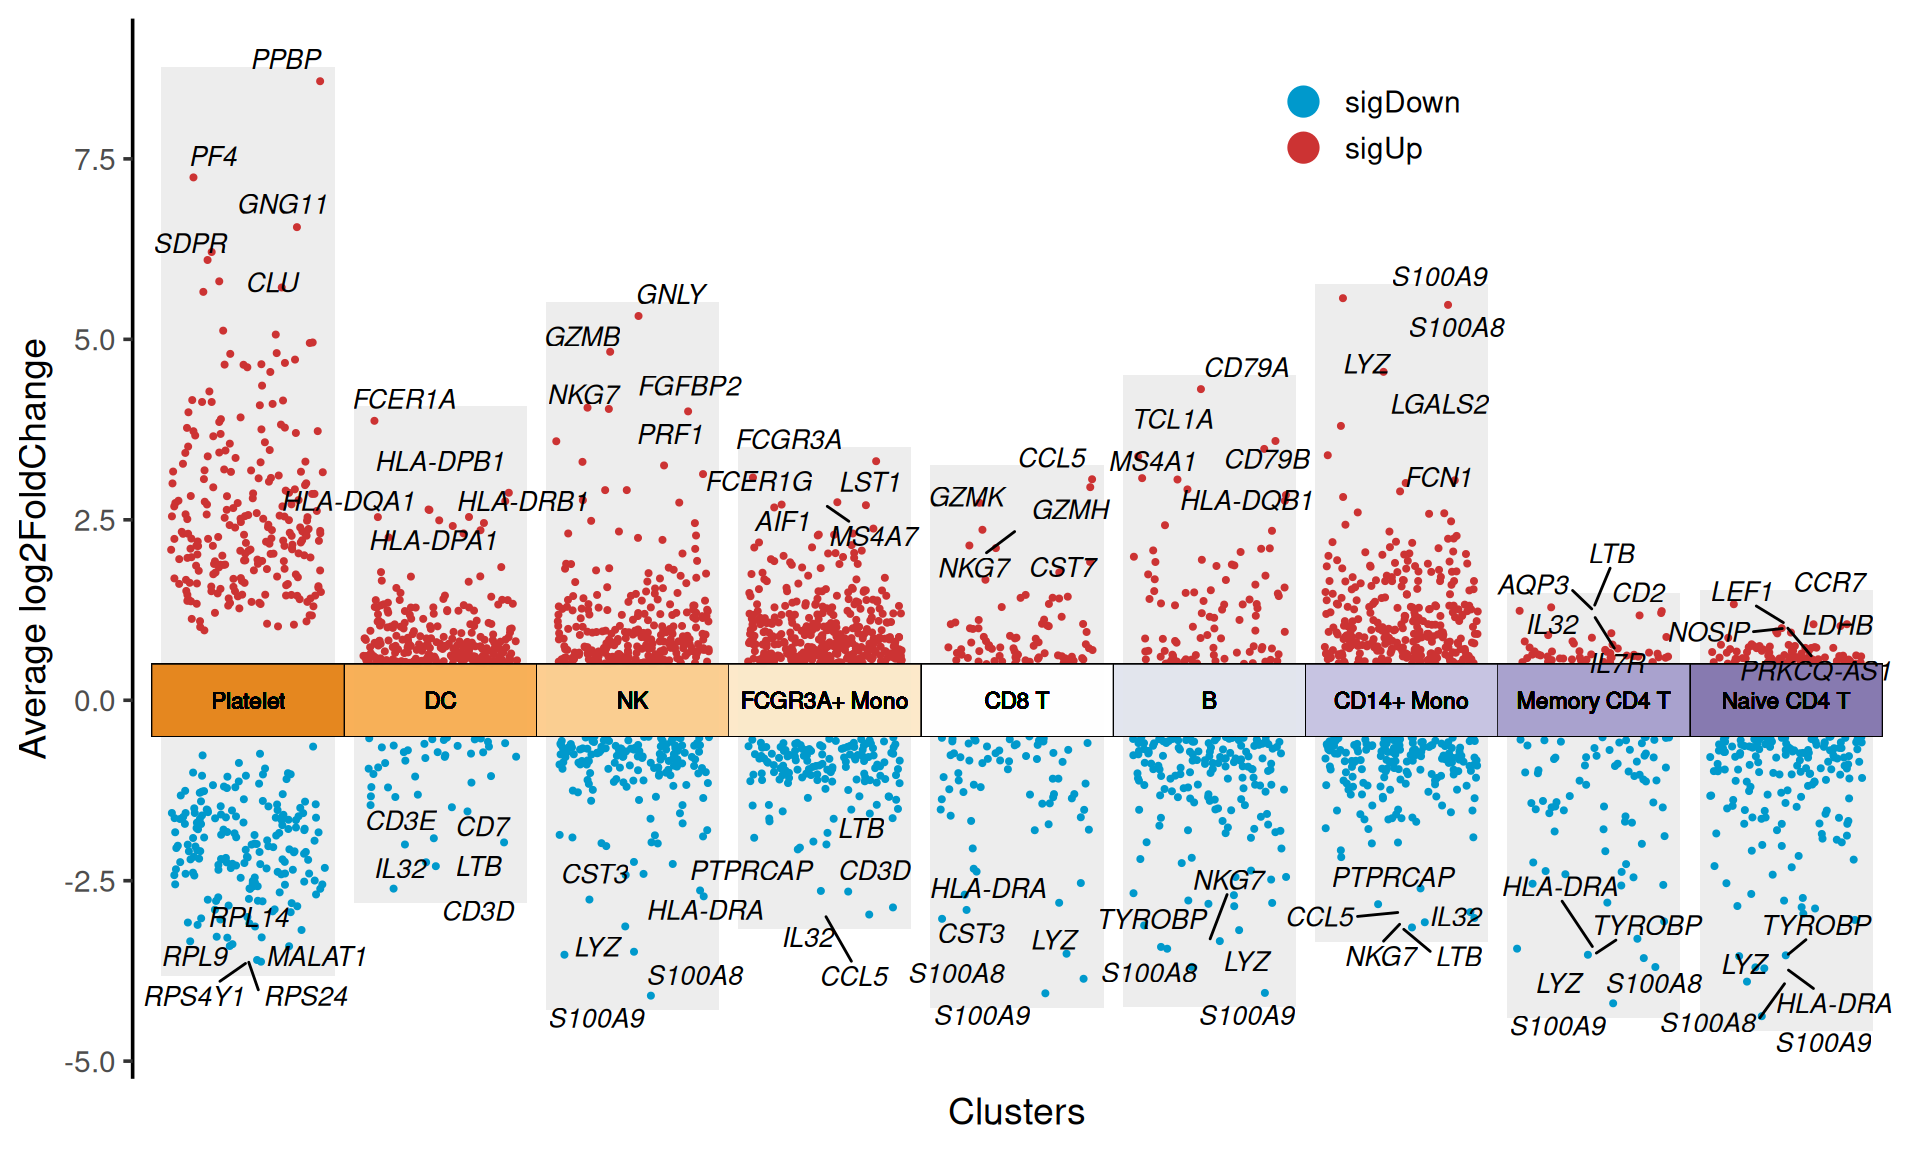
Figure 1 plots the up-regulated and down-regulated differentially expressed genes in the nine single-cell populations.
Tip
Key Parameters:
-
diffData: The input differential gene table, the data structure is shown inpbmc.markers. -
myMarkers: Customize the genes to display text labels, for example:myMarkers = c('PPBP', 'PF4')customizes the text labels for two genes.
# Set myMarkers = c('PPBP', 'PF4')
p <- jjVolcano(
  diffData = pbmc.markers,
  myMarkers = c('PPBP', 'PF4'),
  log2FC.cutoff = 0.5,
  col.type = "updown",
  aesCol = c('#0099CC','#CC3333'),
  tile.col = corrplot::COL2('PuOr', 15)[4:12],
  cluster.order = rev(unique(pbmc.markers$cluster)),
  size  = 3.5,
  fontface = 'italic',
  legend.position = c(0.7,0.9)
  )

p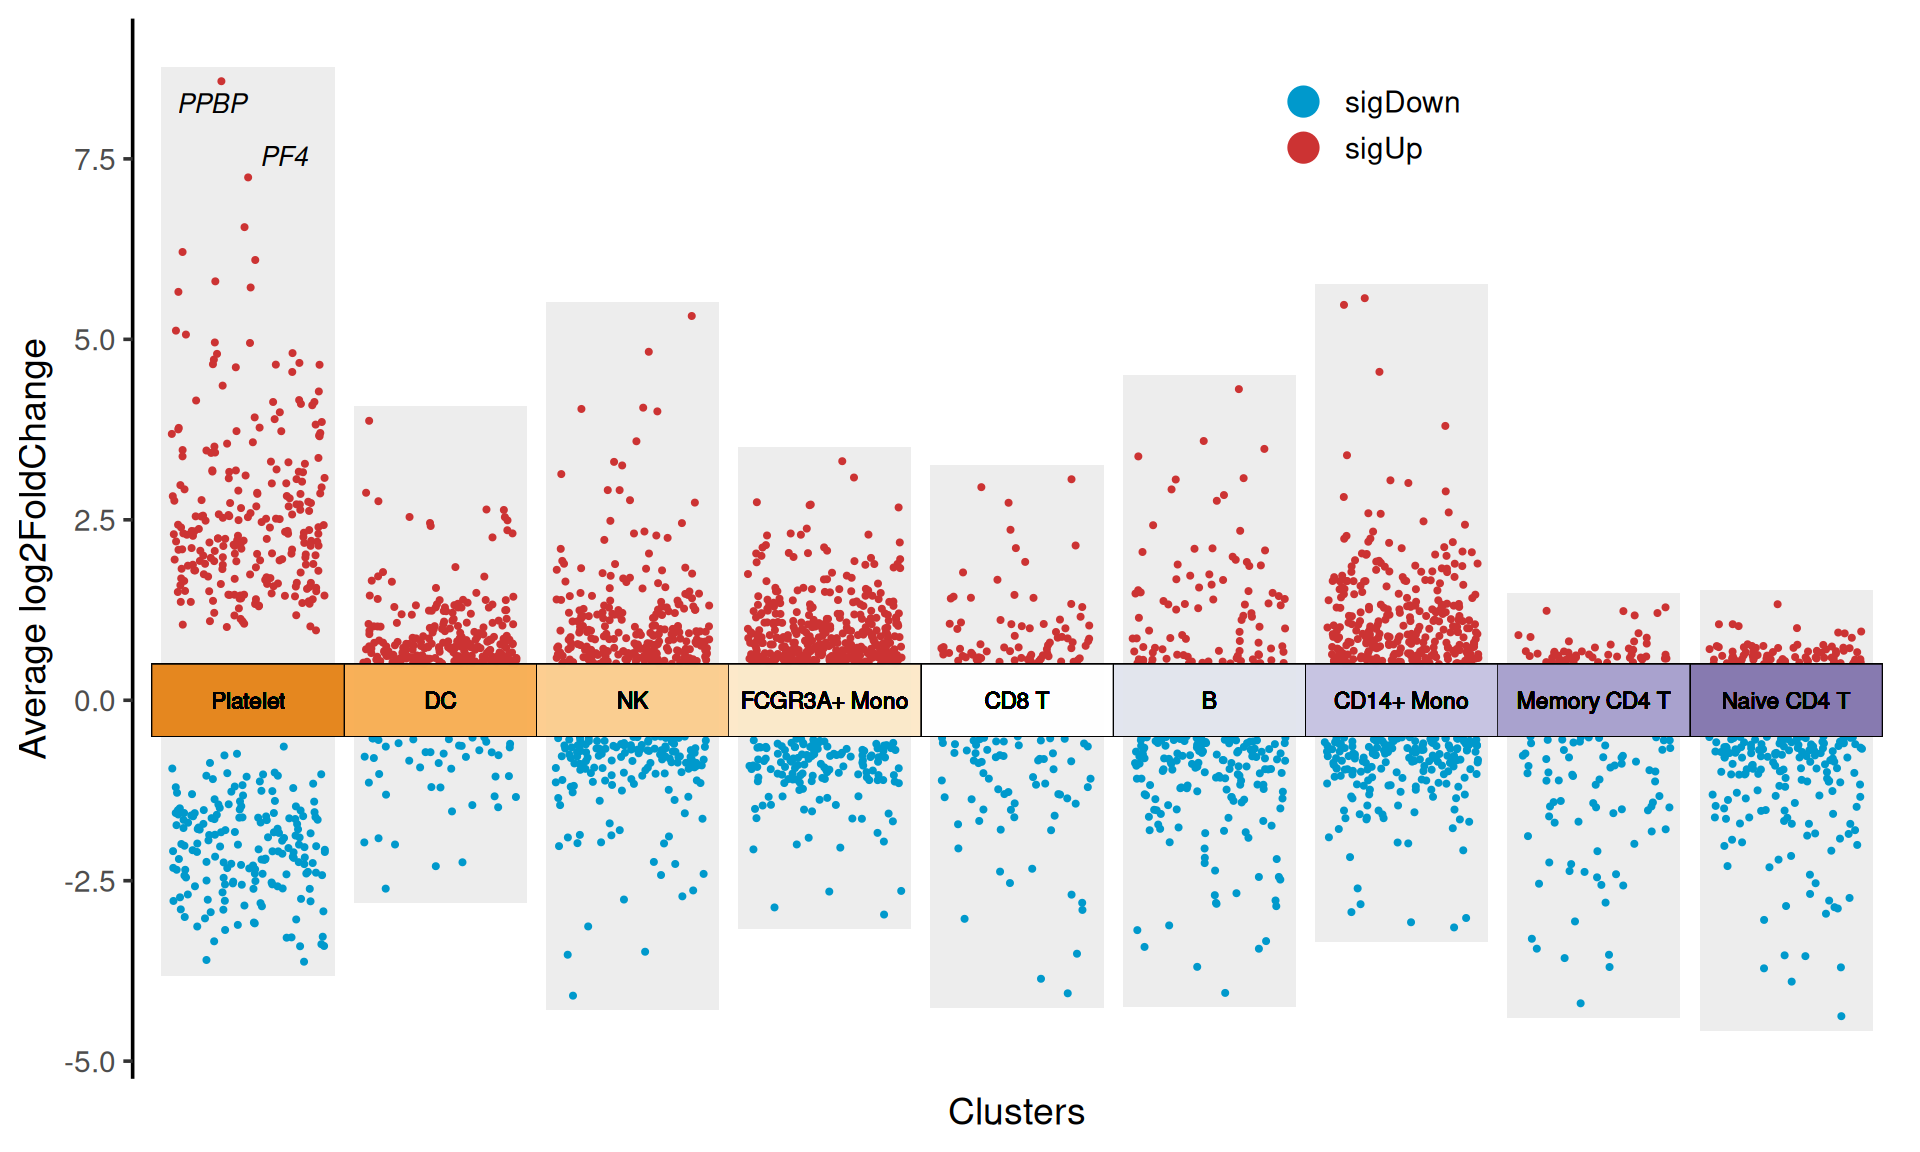
myMarkers
Tip
Key Parameters:
-
topGeneN: How many top gene text labels are displayed? In the example of Figure 1,topGeneN = 5displays the text labels of the top 5 up-regulated and down-regulated genes in each cluster. ThetopGeneNandmyMarkersparameters cannot be used at the same time. -
log2FC.cutoff: Set the threshold of log2FoldChange, which determines the upper and lower boundaries of the grouping box.
# Set log2FC.cutoff=0.5
p1 <- jjVolcano(
  diffData = pbmc.markers,
  topGeneN = 0,
  log2FC.cutoff = 0.5,
  col.type = "updown",
  aesCol = c('#0099CC','#CC3333'),
  tile.col = corrplot::COL2('PuOr', 15)[4:12],
  cluster.order = rev(unique(pbmc.markers$cluster)),
  size  = 3.5,
  fontface = 'italic',
  legend.position = c(0.7,0.9)
  )

# Set log2FC.cutoff=2.5
p2 <- jjVolcano(
  diffData = pbmc.markers,
  topGeneN = 0,
  log2FC.cutoff = 2.5,
  col.type = "updown",
  aesCol = c('#0099CC','#CC3333'),
  tile.col = corrplot::COL2('PuOr', 15)[4:12],
  cluster.order = rev(unique(pbmc.markers$cluster)),
  size  = 3.5,
  fontface = 'italic',
  legend.position = c(0.7,0.9)
  )

p1 + p2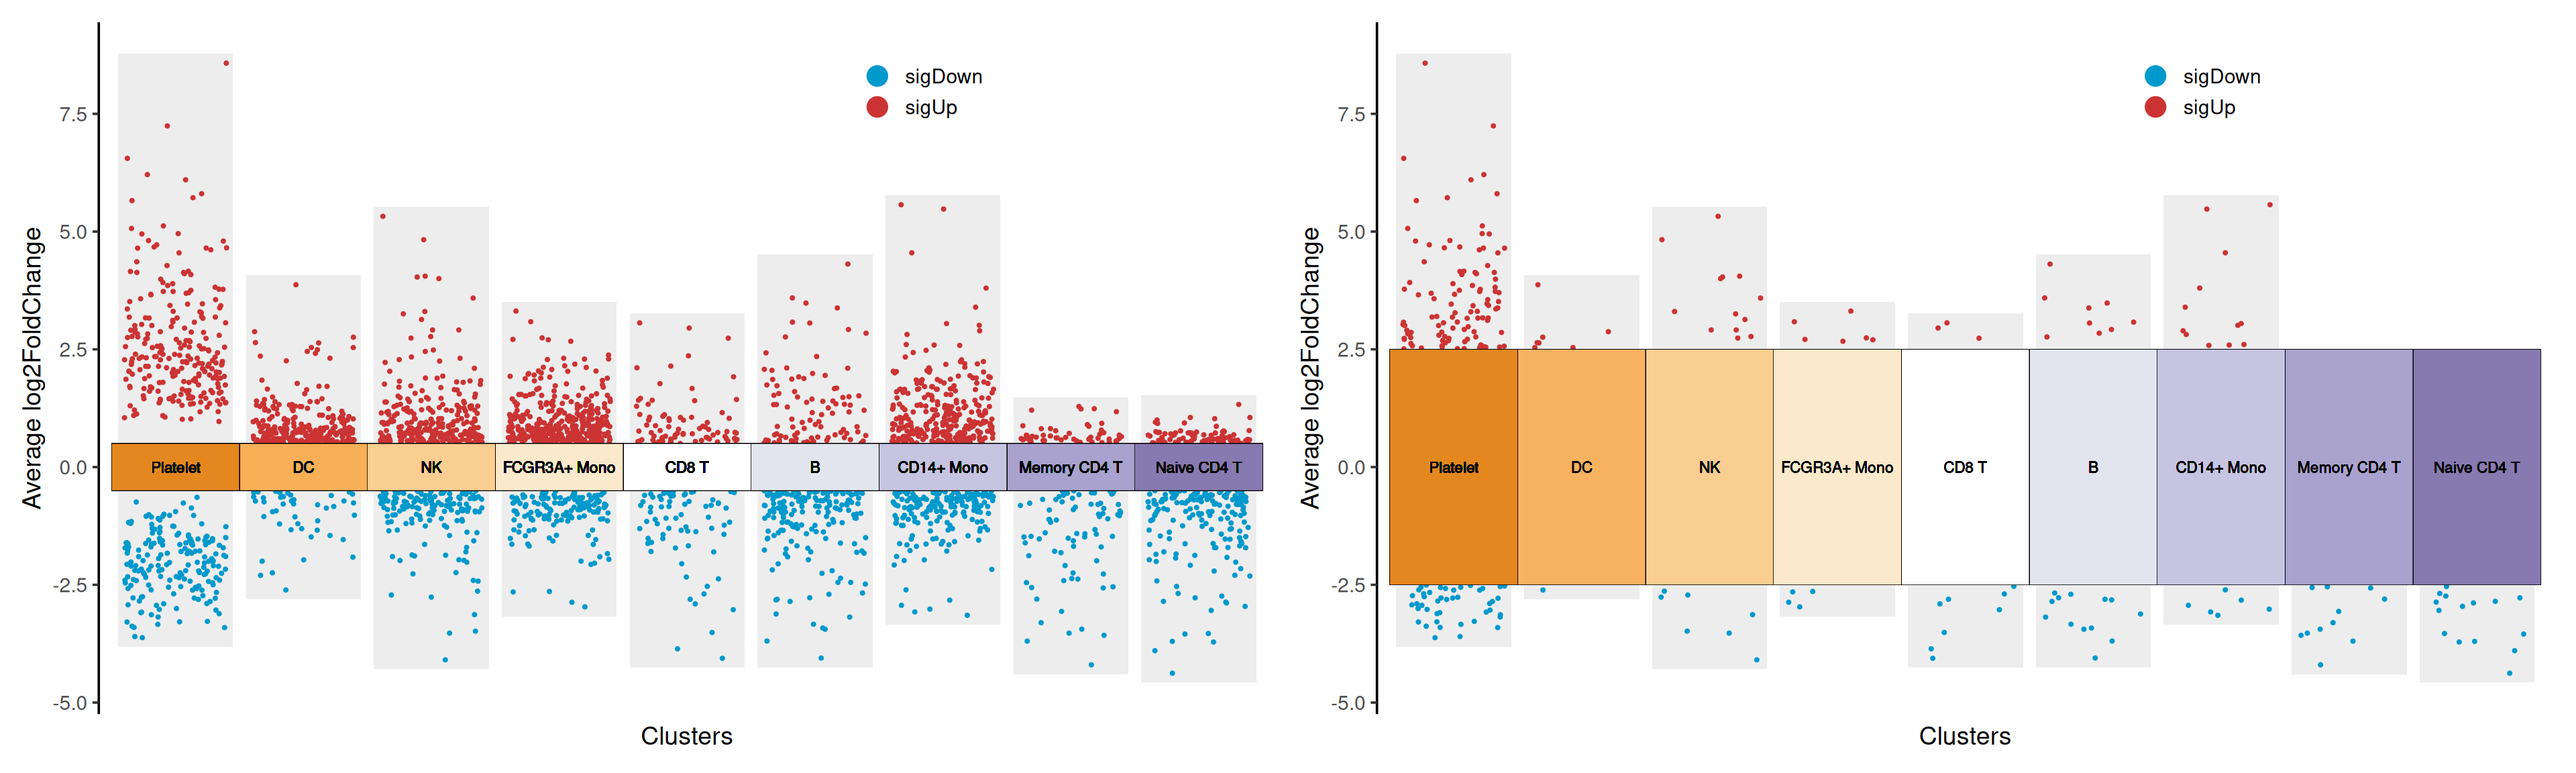
log2FC.cutoff
Tip
Key Parameters:
-
col.type: Scatter point color grouping method, Figure 1 example is grouped by “updown”, and can also be grouped by “adjustP”.
# Set col.type="adjustP"
p <- jjVolcano(
  diffData = pbmc.markers,
  topGeneN = 5,
  log2FC.cutoff = 0.5,
  col.type = "adjustP",
  aesCol = c('#0099CC','#CC3333'),
  tile.col = corrplot::COL2('PuOr', 15)[4:12],
  cluster.order = rev(unique(pbmc.markers$cluster)),
  size  = 3.5,
  fontface = 'italic',
  legend.position = c(0.7,0.9)
  )

p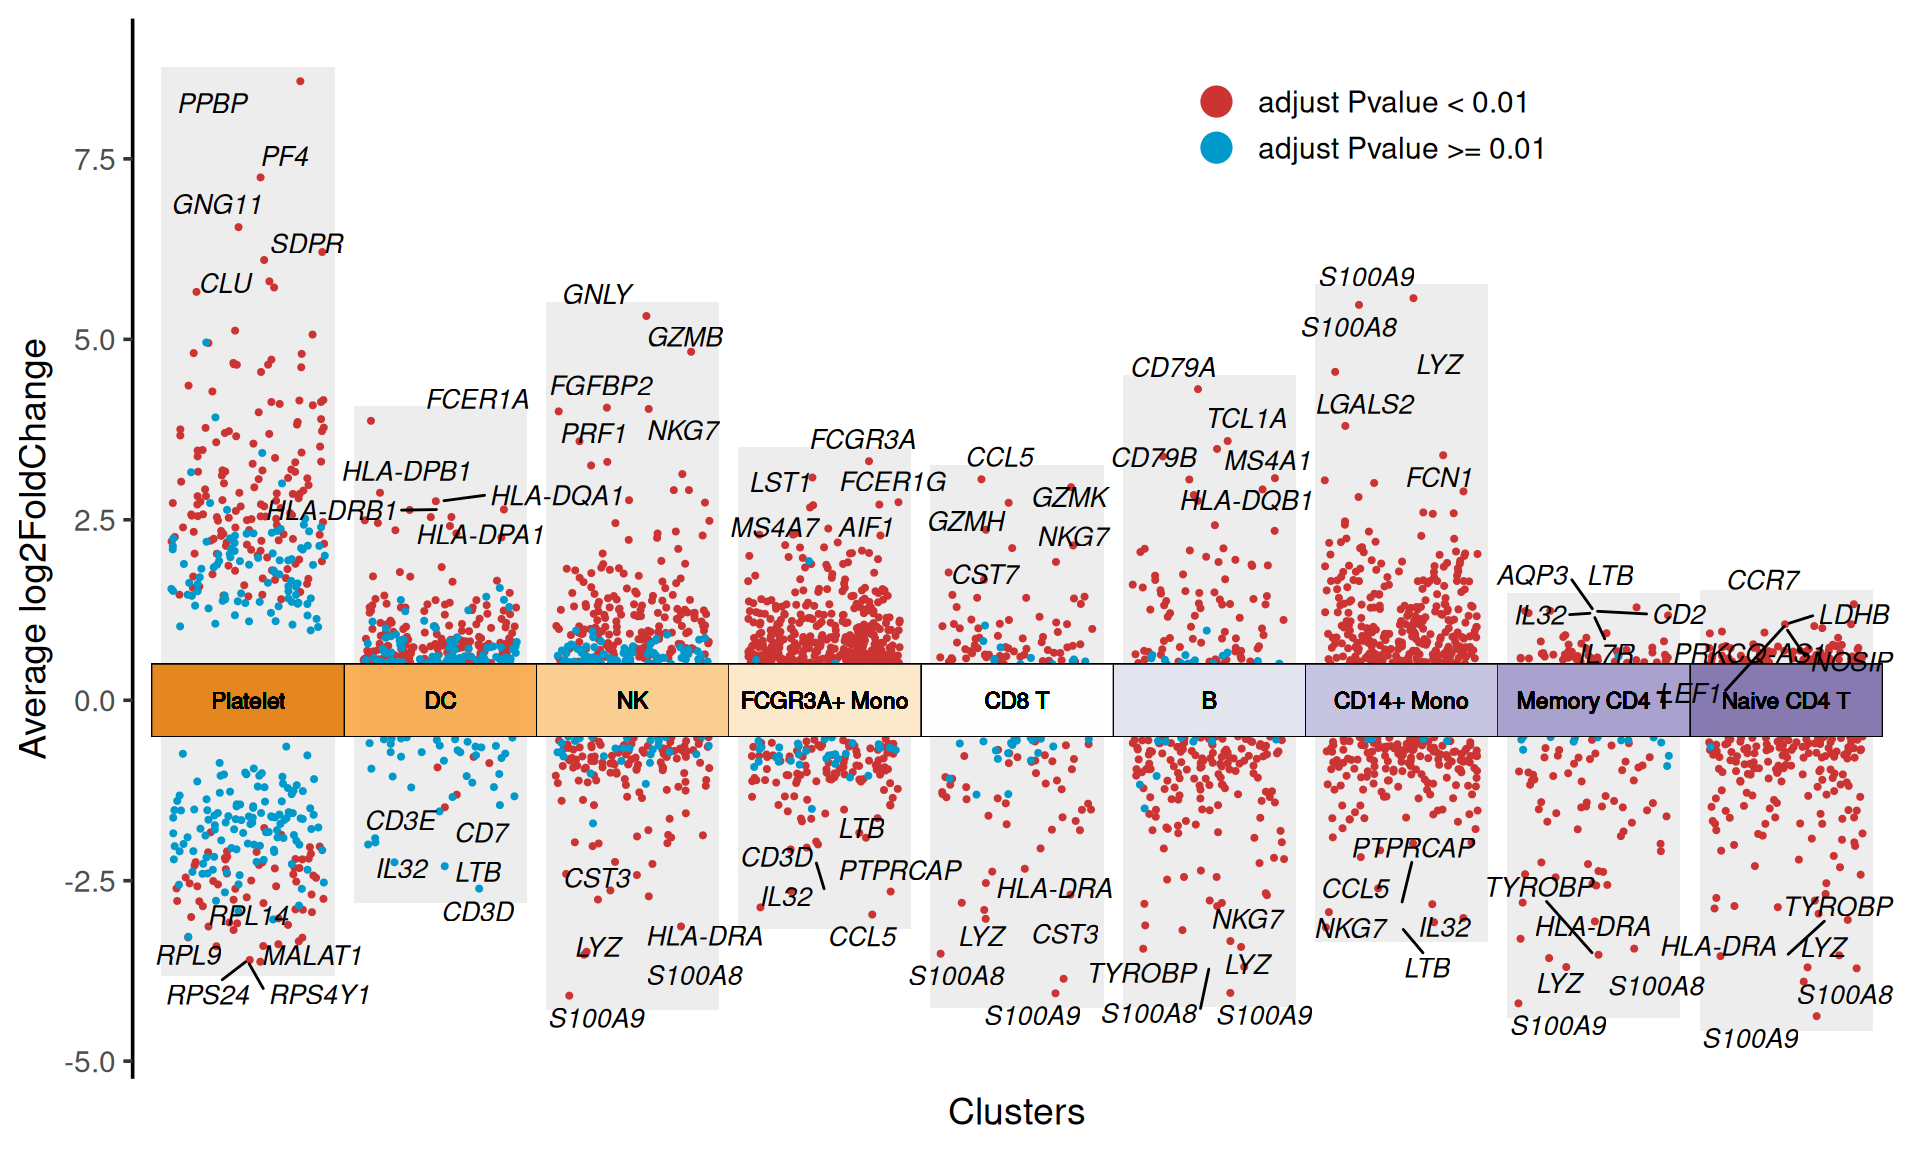
col.type
Tip
Key Parameters:
-
aesCol:Set the color of the scatter points. -
tile.col:Set the color of the grouped blocks. -
cluster.order:Sets the order of grouping blocks. -
size:Set the font size for gene text labels. -
fontface:Set the font style for gene text labels. -
legend.position:Set the position of the legend.
2. Direction of rotation
Use the flip parameter in the jjVolcano function to rotate the orientation of the heatmap.
# Horizontal multiple volcano plot
p <-
  jjVolcano(
    diffData = pbmc.markers,
    tile.col = corrplot::COL2('PiYG', 15)[4:12],
    size  = 3.5,
    fontface = 'italic',
    legend.position = c(0.8,0.2),
    flip = T)

p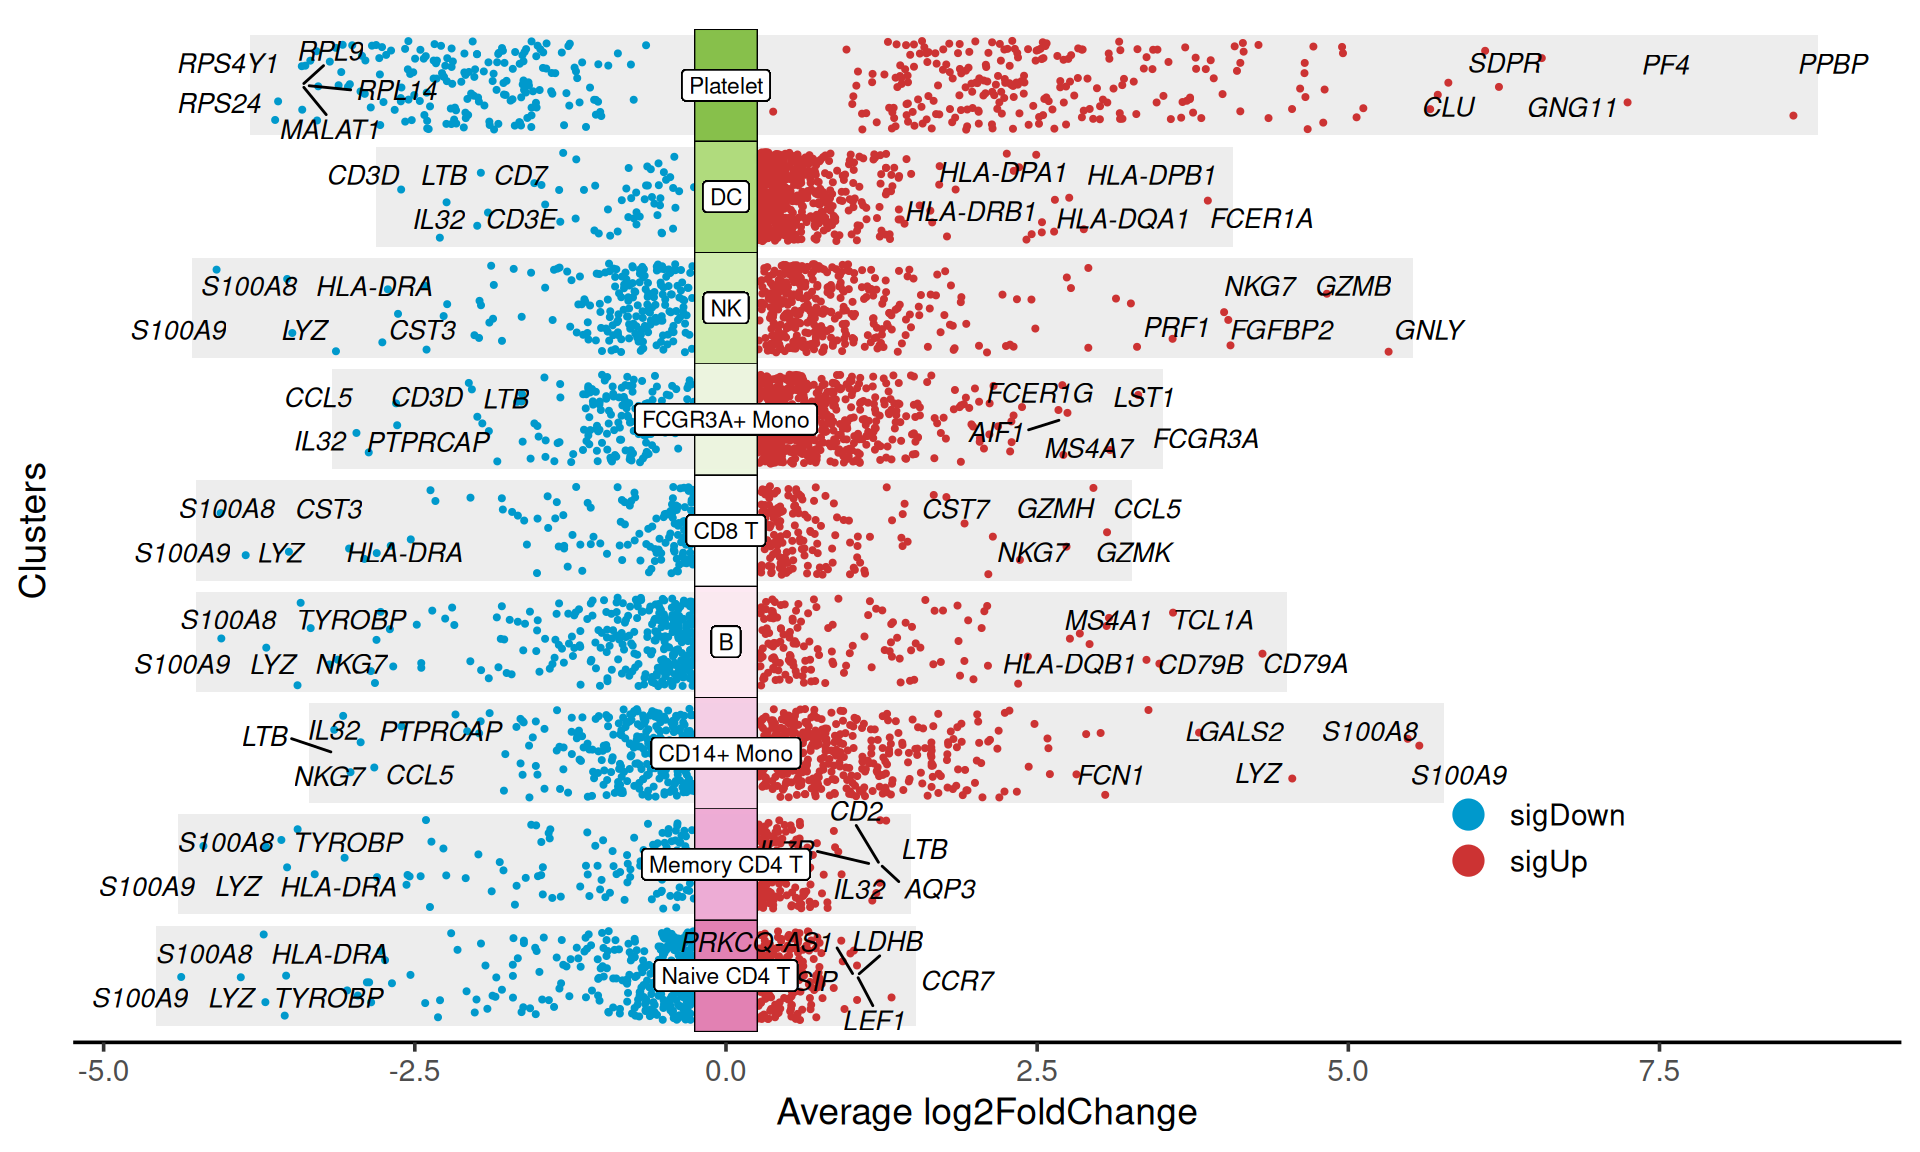
flip
Figure 5. Multiple volcano plots are rotated to horizontal orientation by setting the parameter flip = T.
3. Polar Coordinates
# Polar coordinates Multiple volcano plot
p <- jjVolcano(
  diffData = pbmc.markers,
  tile.col = corrplot::COL2('RdBu', 15)[4:12],
  size  = 3.5,
  fontface = 'italic',
  polar = T)

p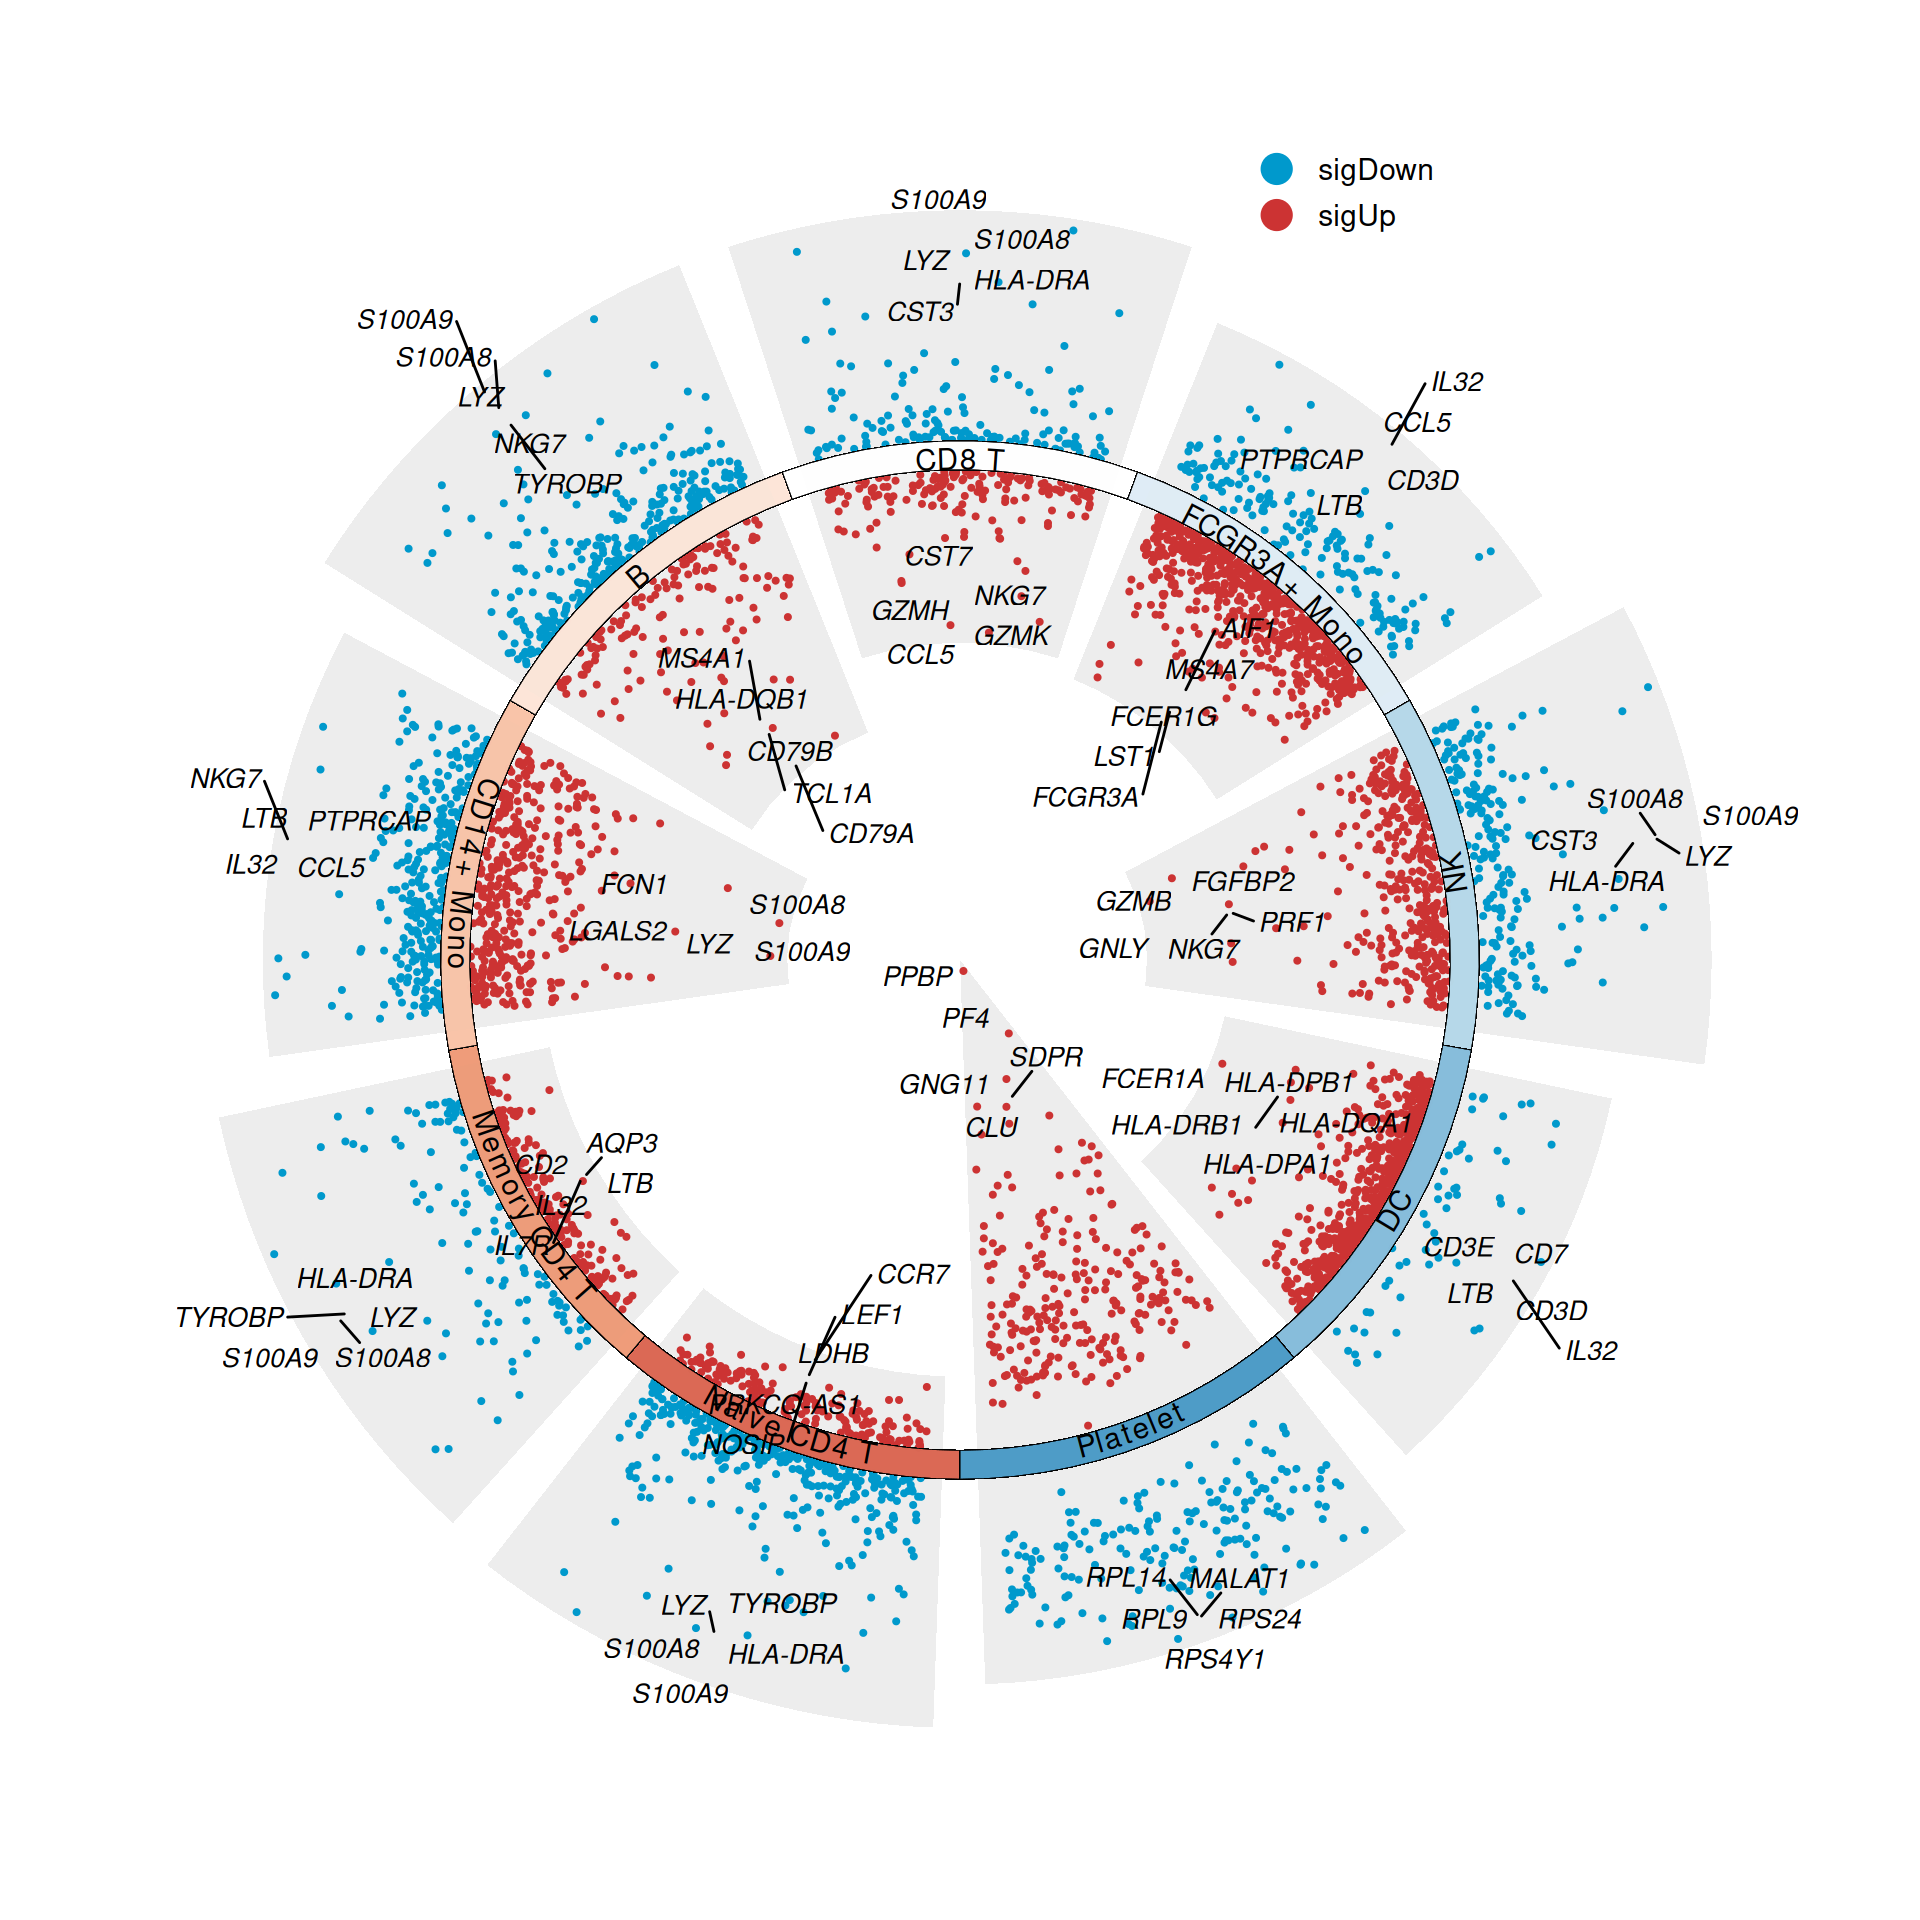
polar
Figure 6 Convert multiple volcano plots to polar coordinates by setting the parameter polar = T.
Applications
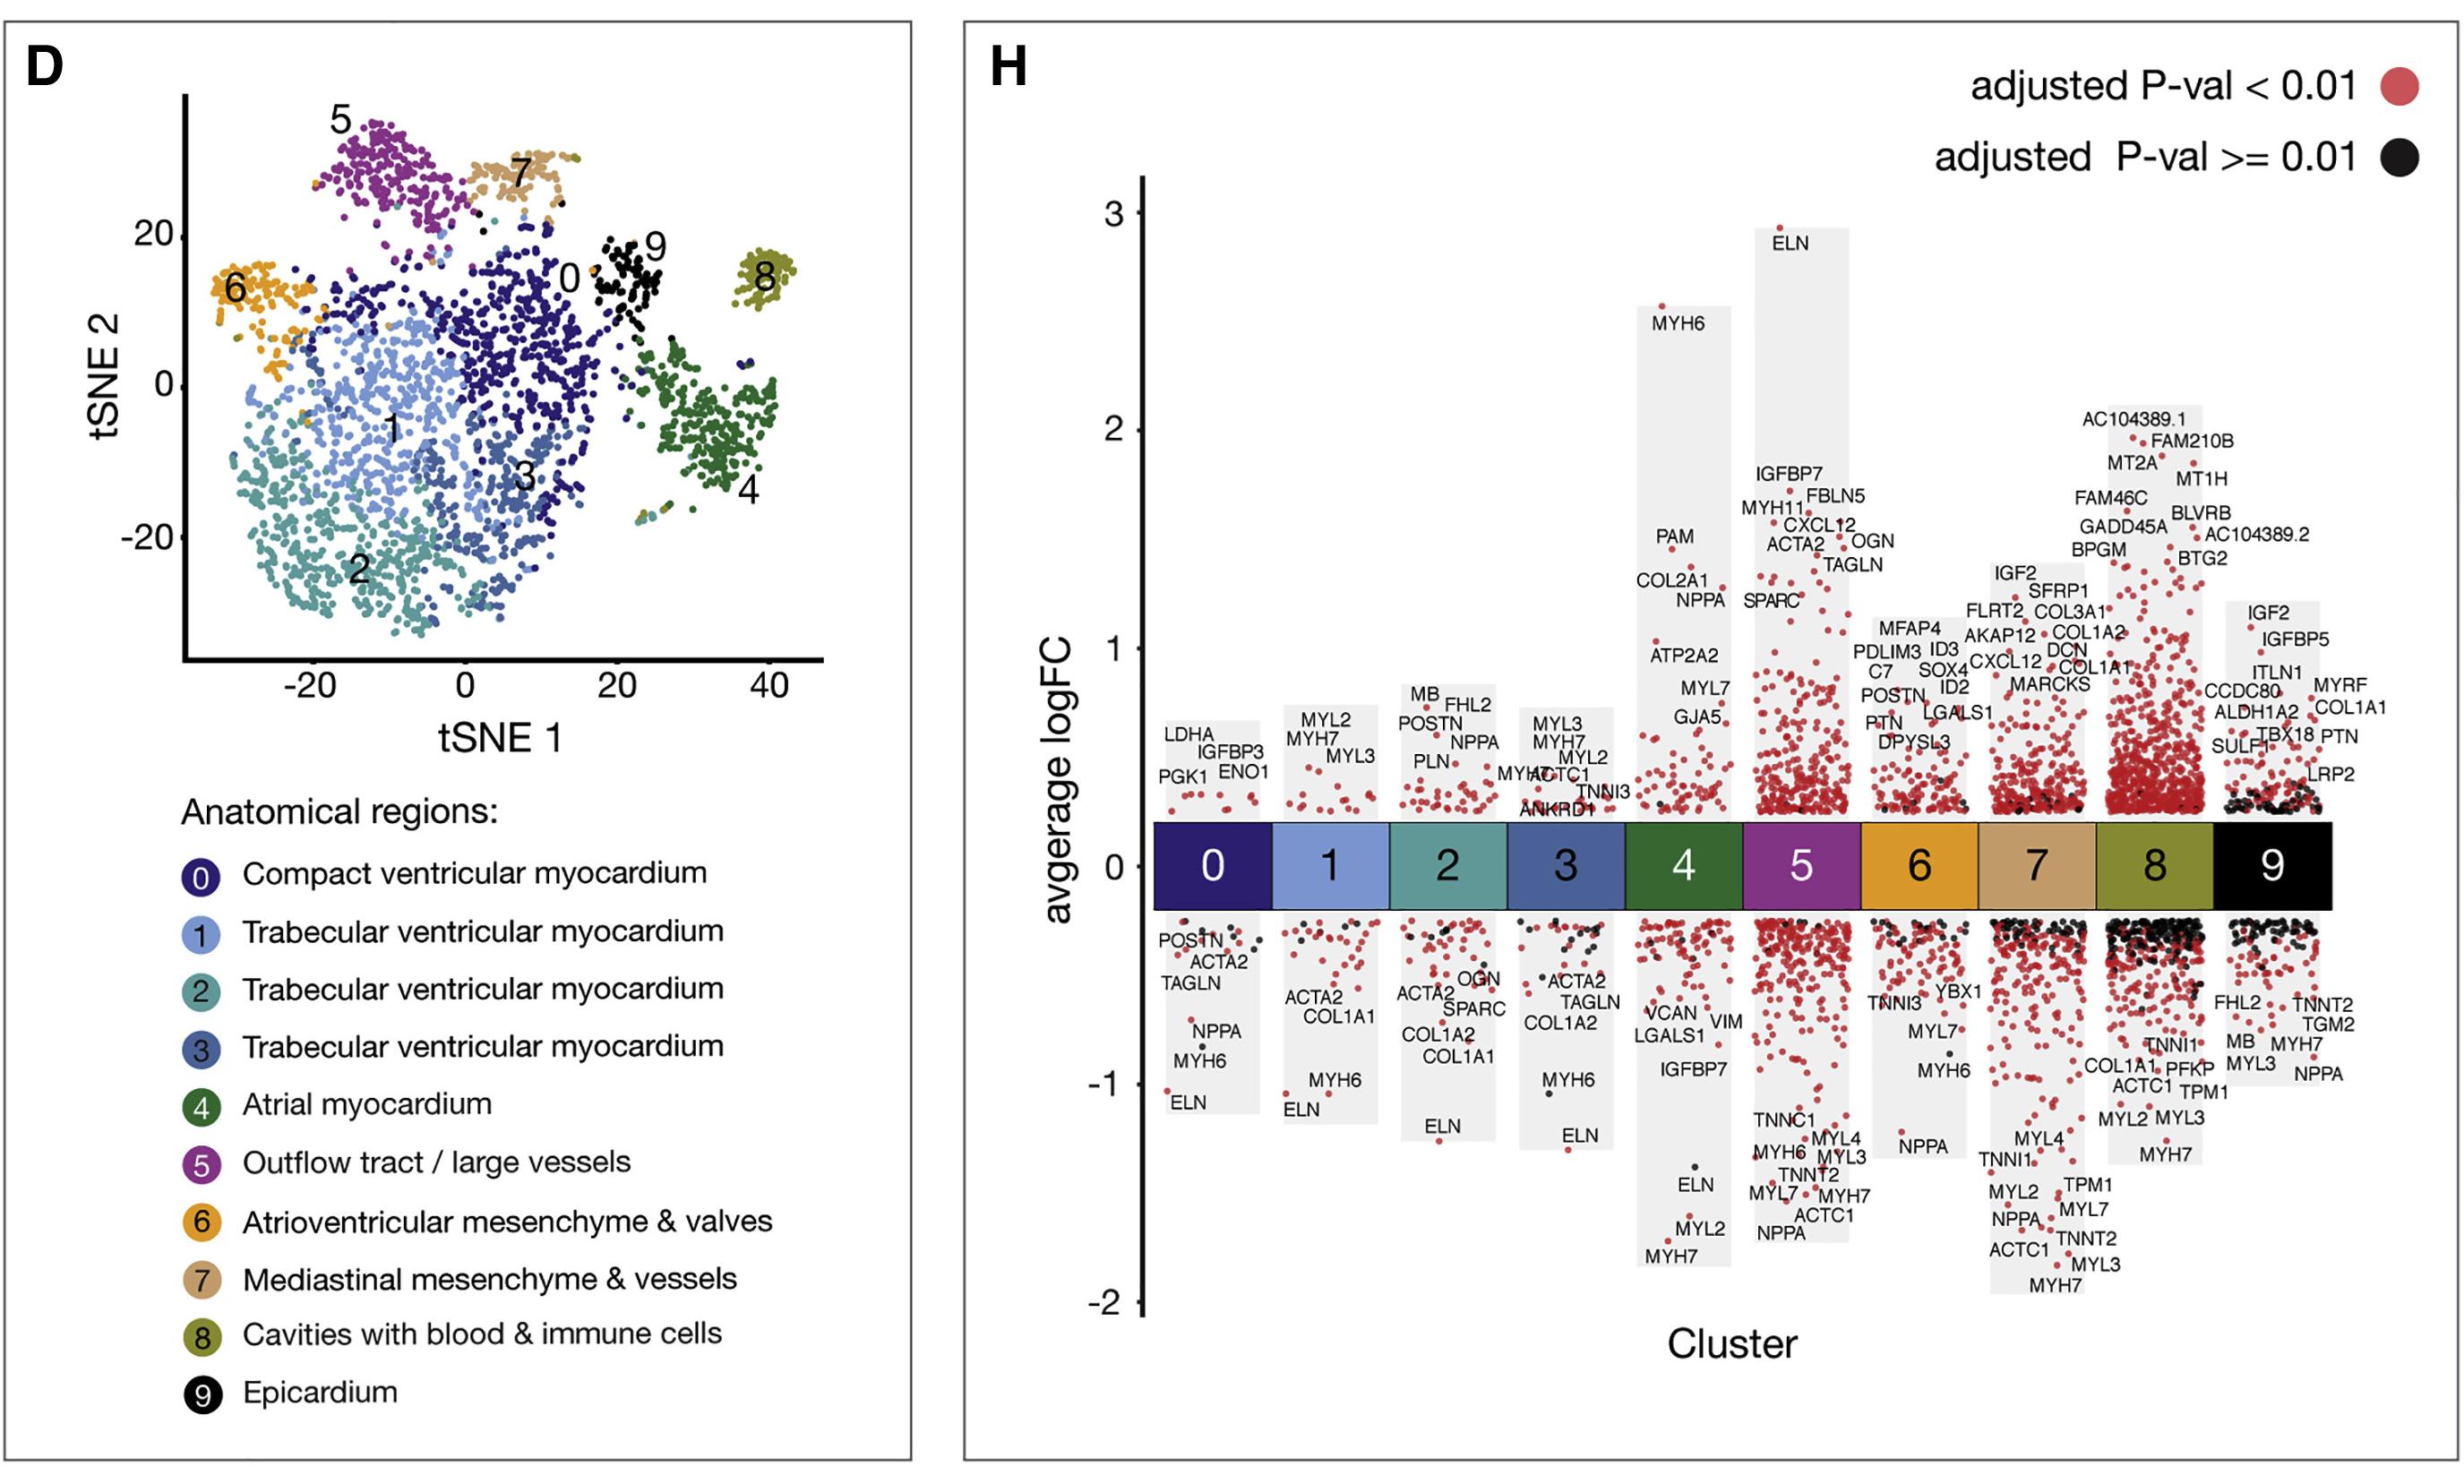
Figure 7H shows the differential gene expression analysis of up- and down-regulated genes in all ten single-cell clusters. Adjusted P values < 0.01 are indicated in red, while adjusted P values ≥ 0.01 are indicated in black. [1]。
Reference
[1] Asp M, Giacomello S, Larsson L, et al. A Spatiotemporal Organ-Wide Gene Expression and Cell Atlas of the Developing Human Heart. Cell. 2019;179(7):1647-1660.e19. doi:10.1016/j.cell.2019.11.025.