# Install packages
if (!requireNamespace("data.table", quietly = TRUE)) {
  install.packages("data.table")
}
if (!requireNamespace("jsonlite", quietly = TRUE)) {
  install.packages("jsonlite")
}
if (!requireNamespace("metawho", quietly = TRUE)) {
  install.packages("metawho")
}
if (!requireNamespace("cowplot", quietly = TRUE)) {
  install.packages("cowplot")
}

# Load packages
library(data.table)
library(jsonlite)
library(metawho)
library(cowplot)Meta-Subgroup Analysis
Note
Hiplot website
This page is the tutorial for source code version of the Hiplot Meta-Subgroup Analysis plugin. You can also use the Hiplot website to achieve no code ploting. For more information please see the following link:
The goal of metawho is to provide simple R implementation of “Meta-analytical method to Identify Who Benefits Most from Treatments”.
metawho is powered by R package metafor and does not support dataset contains individuals for now. Please use stata package ipdmetan if you are more familar with stata code.
Setup
System Requirements: Cross-platform (Linux/MacOS/Windows)
Programming language: R
Dependent packages:
data.table;jsonlite;meta;cowplot
sessioninfo::session_info("attached")─ Session info ───────────────────────────────────────────────────────────────
setting value
version R version 4.6.0 (2026-04-24)
os Ubuntu 24.04.4 LTS
system x86_64, linux-gnu
ui X11
language (EN)
collate C.UTF-8
ctype C.UTF-8
tz UTC
date 2026-05-09
pandoc 3.1.3 @ /usr/bin/ (via rmarkdown)
quarto 1.9.37 @ /usr/local/bin/quarto
─ Packages ───────────────────────────────────────────────────────────────────
package * version date (UTC) lib source
cowplot * 1.2.0 2025-07-07 [1] RSPM
data.table * 1.18.4 2026-05-06 [1] RSPM
jsonlite * 2.0.0 2025-03-27 [1] RSPM
Matrix * 1.7-5 2026-03-21 [3] CRAN (R 4.6.0)
metadat * 1.6-0 2026-04-29 [1] RSPM
metafor * 5.0-1 2026-04-26 [1] RSPM
metawho * 0.2.0 2019-12-06 [1] RSPM
numDeriv * 2016.8-1.1 2019-06-06 [1] RSPM
[1] /home/runner/work/_temp/Library
[2] /opt/R/4.6.0/lib/R/site-library
[3] /opt/R/4.6.0/lib/R/library
* ── Packages attached to the search path.
──────────────────────────────────────────────────────────────────────────────Data Preparation
# Load data
data <- data.table::fread(jsonlite::read_json("https://hiplot.cn/ui/basic/metawho/data.json")$exampleData$textarea[[1]])
data <- as.data.frame(data)
# Convert data structure
data = deft_prepare(data, conf_level = 1 - 0.95)
res = deft_do(data, group_level = unique(data$subgroup))
# View data
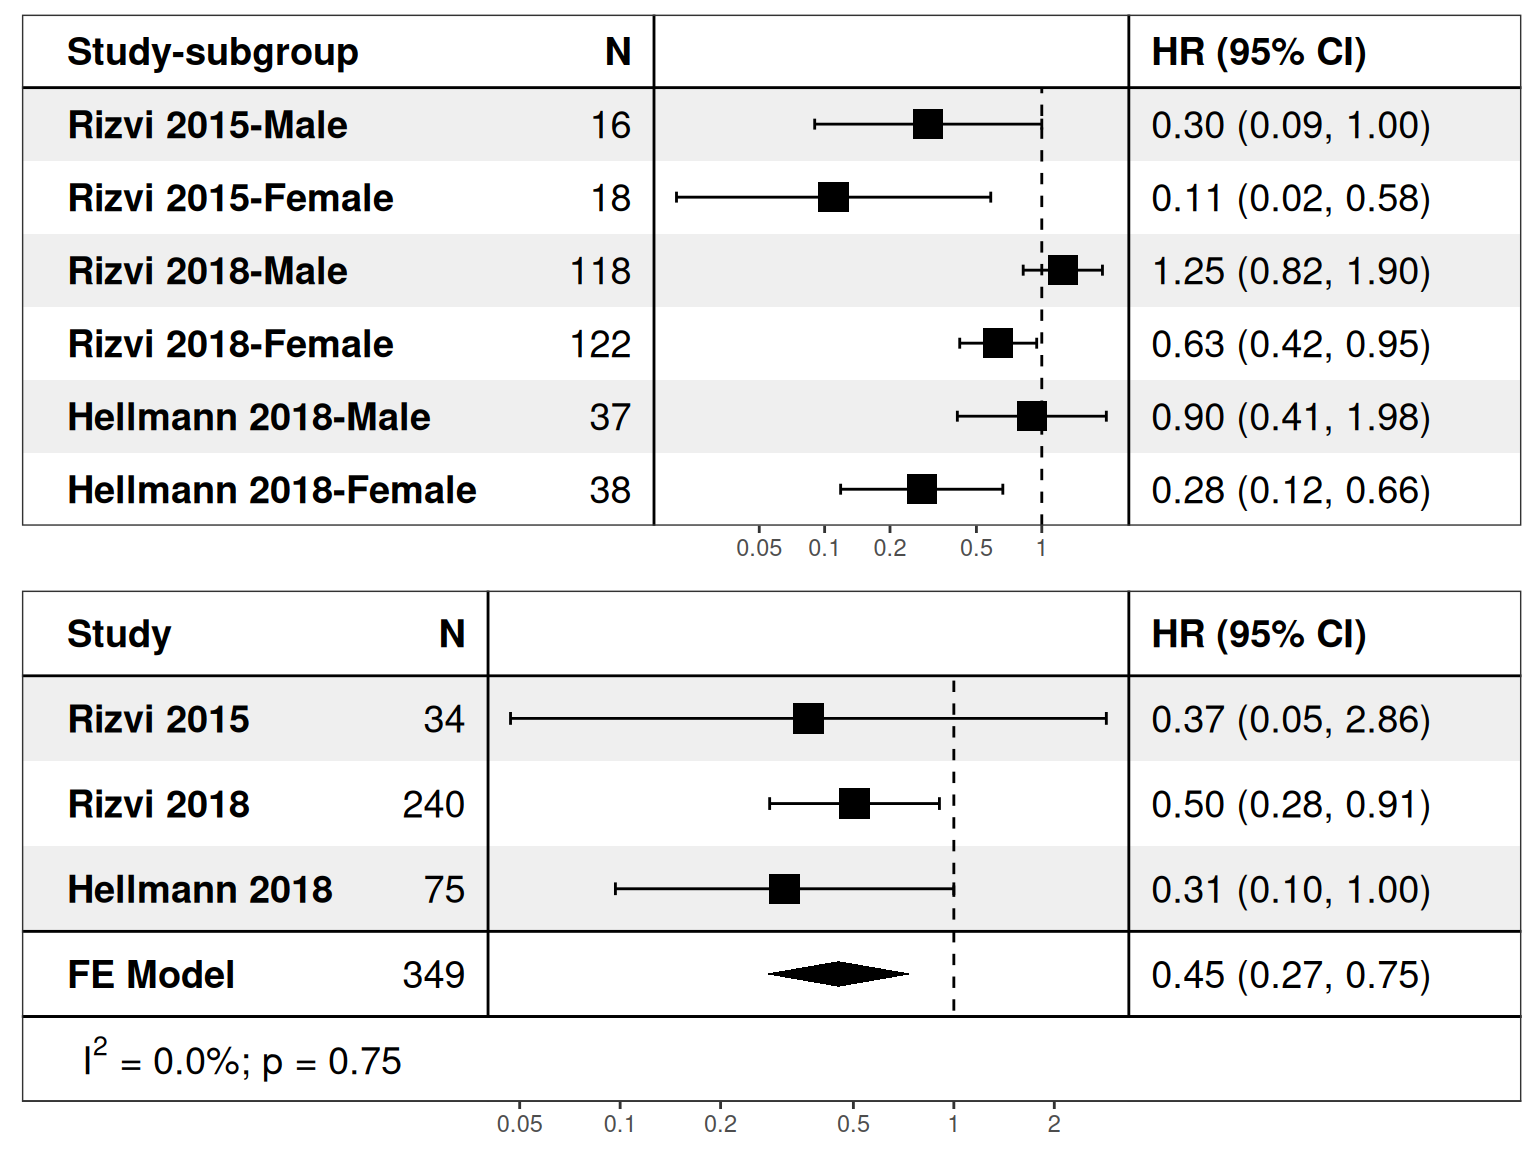
head(data) entry trial subgroup hr ci.lb ci.ub ni conf_q
1 Rizvi 2015-Male Rizvi 2015 Male 0.30 0.09 1.00 16 1.959964
2 Rizvi 2015-Female Rizvi 2015 Female 0.11 0.02 0.56 18 1.959964
3 Rizvi 2018-Male Rizvi 2018 Male 1.25 0.82 1.90 118 1.959964
4 Rizvi 2018-Female Rizvi 2018 Female 0.63 0.42 0.95 122 1.959964
5 Hellmann 2018-Male Hellmann 2018 Male 0.90 0.41 1.99 37 1.959964
6 Hellmann 2018-Female Hellmann 2018 Female 0.28 0.12 0.67 38 1.959964
yi sei
1 -1.2039728 0.6142831
2 -2.2072749 0.8500678
3 0.2231436 0.2143674
4 -0.4620355 0.2082200
5 -0.1053605 0.4030005
6 -1.2729657 0.4387290Visualization
# Meta-Subgroup Analysis
p1 <- deft_show(res, element = "all")
p2 <- deft_show(res, element = "subgroup")
p <- plot_grid(p1, p2, nrow = 2)

p