# Install packages
if (!requireNamespace("data.table", quietly = TRUE)) {
  install.packages("data.table")
}
if (!requireNamespace("jsonlite", quietly = TRUE)) {
  install.packages("jsonlite")
}
if (!requireNamespace("waterfalls", quietly = TRUE)) {
  install.packages("waterfalls")
}
if (!requireNamespace("ggplot2", quietly = TRUE)) {
  install.packages("ggplot2")
}

# Load packages
library(data.table)
library(jsonlite)
library(waterfalls)
library(ggplot2)Waterfalls Plot2
Note
Hiplot website
This page is the tutorial for source code version of the Hiplot Waterfalls Plot2 plugin. You can also use the Hiplot website to achieve no code ploting. For more information please see the following link:
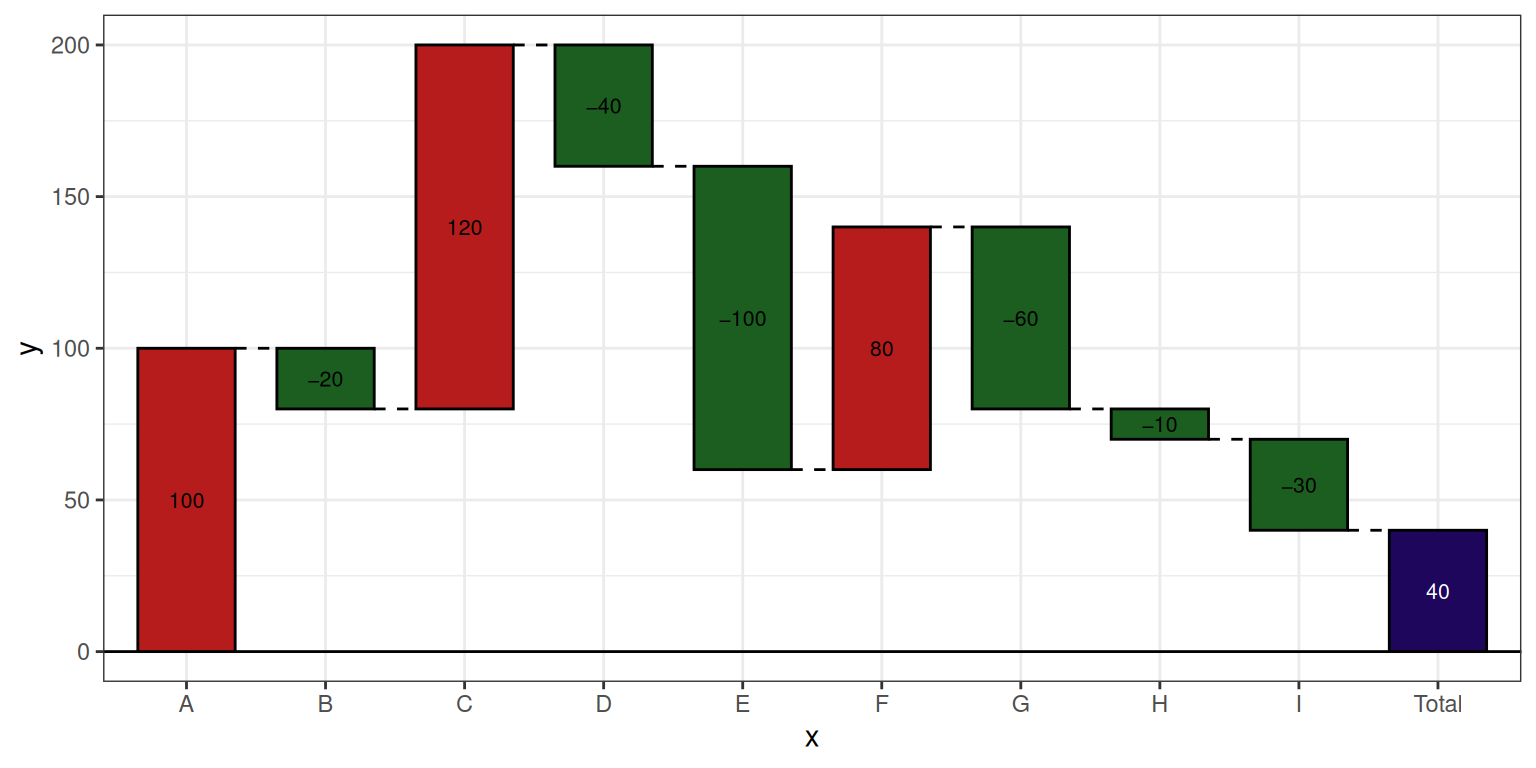
Used to visualize changes in data, with the difference from version 1 being the ability to customize the colors for upward and downward values.
Setup
System Requirements: Cross-platform (Linux/MacOS/Windows)
Programming language: R
Dependent packages:
data.table;jsonlite;waterfalls;ggplot2
sessioninfo::session_info("attached")─ Session info ───────────────────────────────────────────────────────────────
setting value
version R version 4.6.0 (2026-04-24)
os Ubuntu 24.04.4 LTS
system x86_64, linux-gnu
ui X11
language (EN)
collate C.UTF-8
ctype C.UTF-8
tz UTC
date 2026-05-09
pandoc 3.1.3 @ /usr/bin/ (via rmarkdown)
quarto 1.9.37 @ /usr/local/bin/quarto
─ Packages ───────────────────────────────────────────────────────────────────
package * version date (UTC) lib source
data.table * 1.18.4 2026-05-06 [1] RSPM
ggplot2 * 4.0.3.9000 2026-05-04 [1] Github (tidyverse/ggplot2@6870419)
jsonlite * 2.0.0 2025-03-27 [1] RSPM
waterfalls * 1.0.0 2022-11-20 [1] RSPM
[1] /home/runner/work/_temp/Library
[2] /opt/R/4.6.0/lib/R/site-library
[3] /opt/R/4.6.0/lib/R/library
* ── Packages attached to the search path.
──────────────────────────────────────────────────────────────────────────────Data Preparation
# Load data
data <- data.table::fread(jsonlite::read_json("https://hiplot.cn/ui/basic/waterfalls-plot/data.json")$exampleData$textarea[[1]])
data <- as.data.frame(data)

# convert data structure
data[["name"]] <- factor(data[["name"]], levels = data[["name"]])
data$fill <- ifelse(data$value > 0, "#B71C1C", "#1B5E20")

# View data
head(data)
name value fill
1 A 100 #B71C1C
2 B -20 #1B5E20
3 C 120 #B71C1C
4 D -40 #1B5E20
5 E -100 #1B5E20
6 F 80 #B71C1CVisualization
# Waterfalls Plot2
p <- waterfall(data, calc_total = T, rect_width = 0.7, fill_by_sign = F,
               fill_colours = data$fill, total_rect_color = "#1E065D") +
  theme_bw()

p