# Install packages
if (!requireNamespace("data.table", quietly = TRUE)) {
  install.packages("data.table")
}
if (!requireNamespace("jsonlite", quietly = TRUE)) {
  install.packages("jsonlite")
}
if (!requireNamespace("ggplotify", quietly = TRUE)) {
  install.packages("ggplotify")
}
if (!requireNamespace("likert", quietly = TRUE)) {
  install.packages("likert")
}

# Load packages
library(data.table)
library(jsonlite)
library(ggplotify)
library(likert)Likert Plot
Note
Hiplot website
This page is the tutorial for source code version of the Hiplot Likert Plot plugin. You can also use the Hiplot website to achieve no code ploting. For more information please see the following link:
Descriptive statistical analysis of Likert scale data.
Setup
System Requirements: Cross-platform (Linux/MacOS/Windows)
Programming language: R
Dependent packages:
data.table;jsonlite;ggplotify;likert
sessioninfo::session_info("attached")─ Session info ───────────────────────────────────────────────────────────────
setting value
version R version 4.6.0 (2026-04-24)
os Ubuntu 24.04.4 LTS
system x86_64, linux-gnu
ui X11
language (EN)
collate C.UTF-8
ctype C.UTF-8
tz UTC
date 2026-05-09
pandoc 3.1.3 @ /usr/bin/ (via rmarkdown)
quarto 1.9.37 @ /usr/local/bin/quarto
─ Packages ───────────────────────────────────────────────────────────────────
package * version date (UTC) lib source
data.table * 1.18.4 2026-05-06 [1] RSPM
ggplot2 * 4.0.3.9000 2026-05-04 [1] Github (tidyverse/ggplot2@6870419)
ggplotify * 0.1.3 2025-09-20 [1] RSPM
jsonlite * 2.0.0 2025-03-27 [1] RSPM
likert * 1.3.5.1 2025-08-02 [1] RSPM
xtable * 1.8-8 2026-02-22 [1] RSPM
[1] /home/runner/work/_temp/Library
[2] /opt/R/4.6.0/lib/R/site-library
[3] /opt/R/4.6.0/lib/R/library
* ── Packages attached to the search path.
──────────────────────────────────────────────────────────────────────────────Data Preparation
# Load data
data <- data.table::fread(jsonlite::read_json("https://hiplot.cn/ui/basic/likert/data.json")$exampleData$textarea[[1]])
data <- as.data.frame(data)

# Convert data structure
levs <- unique(unlist(data))
for (i in 1:ncol(data)) {
  data[,i] <- factor(data[, i], levels = levs)
}

# View data
head(data)
ST24Q01 ST24Q02 ST24Q03 ST24Q04
1 Strongly disagree Strongly agree Agree Strongly disagree
2 Disagree Strongly agree Strongly agree Strongly disagree
3 Disagree Disagree Disagree Agree
4 Disagree Disagree Disagree Disagree
5 Disagree Agree Disagree Strongly disagree
6 Agree Strongly disagree Agree Strongly disagree
ST24Q05 ST24Q06 ST24Q07 ST24Q08
1 Agree Strongly disagree Agree Disagree
2 Strongly agree Strongly disagree Agree Disagree
3 Disagree Disagree Disagree Disagree
4 Disagree Strongly disagree Disagree Disagree
5 Agree Strongly disagree Strongly agree Strongly disagree
6 Strongly disagree Disagree Disagree Agree
ST24Q09 ST24Q10 ST24Q11
1 Strongly disagree Agree Agree
2 Strongly disagree Agree Agree
3 Disagree Disagree Disagree
4 Strongly disagree Disagree Disagree
5 Strongly disagree Strongly disagree Agree
6 Disagree Agree Strongly disagreeVisualization
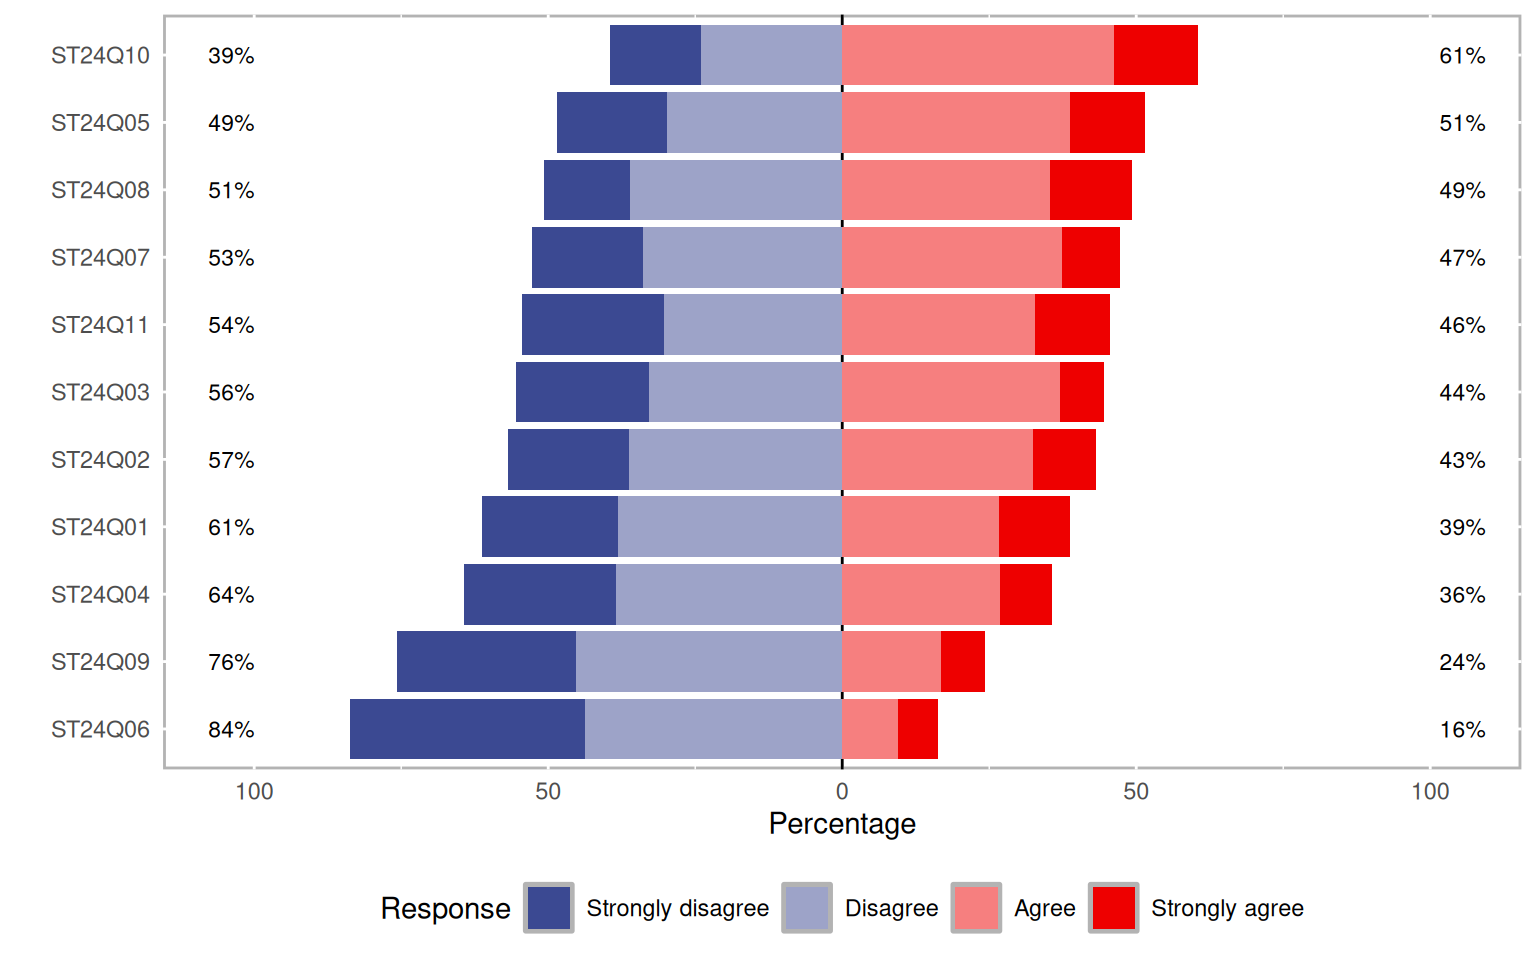
# Likert Plot
pobj <- likert(data)
colrs <- c("#3B4992FF","#EE0000FF")
p <- as.ggplot(plot(pobj, type = "bar",
                    low.color = colrs[1], high.color = colrs[2], wrap = 50))

p