# Install packages
if (!requireNamespace("data.table", quietly = TRUE)) {
  install.packages("data.table")
}
if (!requireNamespace("jsonlite", quietly = TRUE)) {
  install.packages("jsonlite")
}
if (!requireNamespace("NeuralNetTools", quietly = TRUE)) {
  install.packages("NeuralNetTools")
}
if (!requireNamespace("nnet", quietly = TRUE)) {
  install.packages("nnet")
}

# Load packages
library(data.table)
library(jsonlite)
library(NeuralNetTools)
library(nnet)Neural Network
Note
Hiplot website
This page is the tutorial for source code version of the Hiplot Neural Network plugin. You can also use the Hiplot website to achieve no code ploting. For more information please see the following link:
Setup
System Requirements: Cross-platform (Linux/MacOS/Windows)
Programming language: R
Dependent packages:
data.table;jsonlite;NeuralNetTools;nnet
sessioninfo::session_info("attached")─ Session info ───────────────────────────────────────────────────────────────
setting value
version R version 4.6.0 (2026-04-24)
os Ubuntu 24.04.4 LTS
system x86_64, linux-gnu
ui X11
language (EN)
collate C.UTF-8
ctype C.UTF-8
tz UTC
date 2026-05-09
pandoc 3.1.3 @ /usr/bin/ (via rmarkdown)
quarto 1.9.37 @ /usr/local/bin/quarto
─ Packages ───────────────────────────────────────────────────────────────────
package * version date (UTC) lib source
data.table * 1.18.4 2026-05-06 [1] RSPM
jsonlite * 2.0.0 2025-03-27 [1] RSPM
NeuralNetTools * 1.5.3 2022-01-06 [1] RSPM
nnet * 7.3-20 2025-01-01 [3] CRAN (R 4.6.0)
[1] /home/runner/work/_temp/Library
[2] /opt/R/4.6.0/lib/R/site-library
[3] /opt/R/4.6.0/lib/R/library
* ── Packages attached to the search path.
──────────────────────────────────────────────────────────────────────────────Data Preparation
# Load data
data <- data.table::fread(jsonlite::read_json("https://hiplot.cn/ui/basic/neural-network/data.json")$exampleData$textarea[[1]])
data <- as.data.frame(data)

# View data
head(data)
Y1 Y2 X1 X2 X3
1 0.7646258 0.5494452 -0.89691455 -1.8923489 0.6408445
2 0.2383994 0.4605024 0.18484918 1.2928042 -1.6013778
3 0.3800247 0.2527468 1.58784533 -0.6182543 -0.7778154
4 0.3545279 0.6319730 -1.13037567 1.0409383 -1.6473925
5 0.3667356 0.4684437 -0.08025176 1.1758795 0.1542662
6 0.5509560 0.4439474 0.13242028 -1.5018321 -1.1756313Visualization
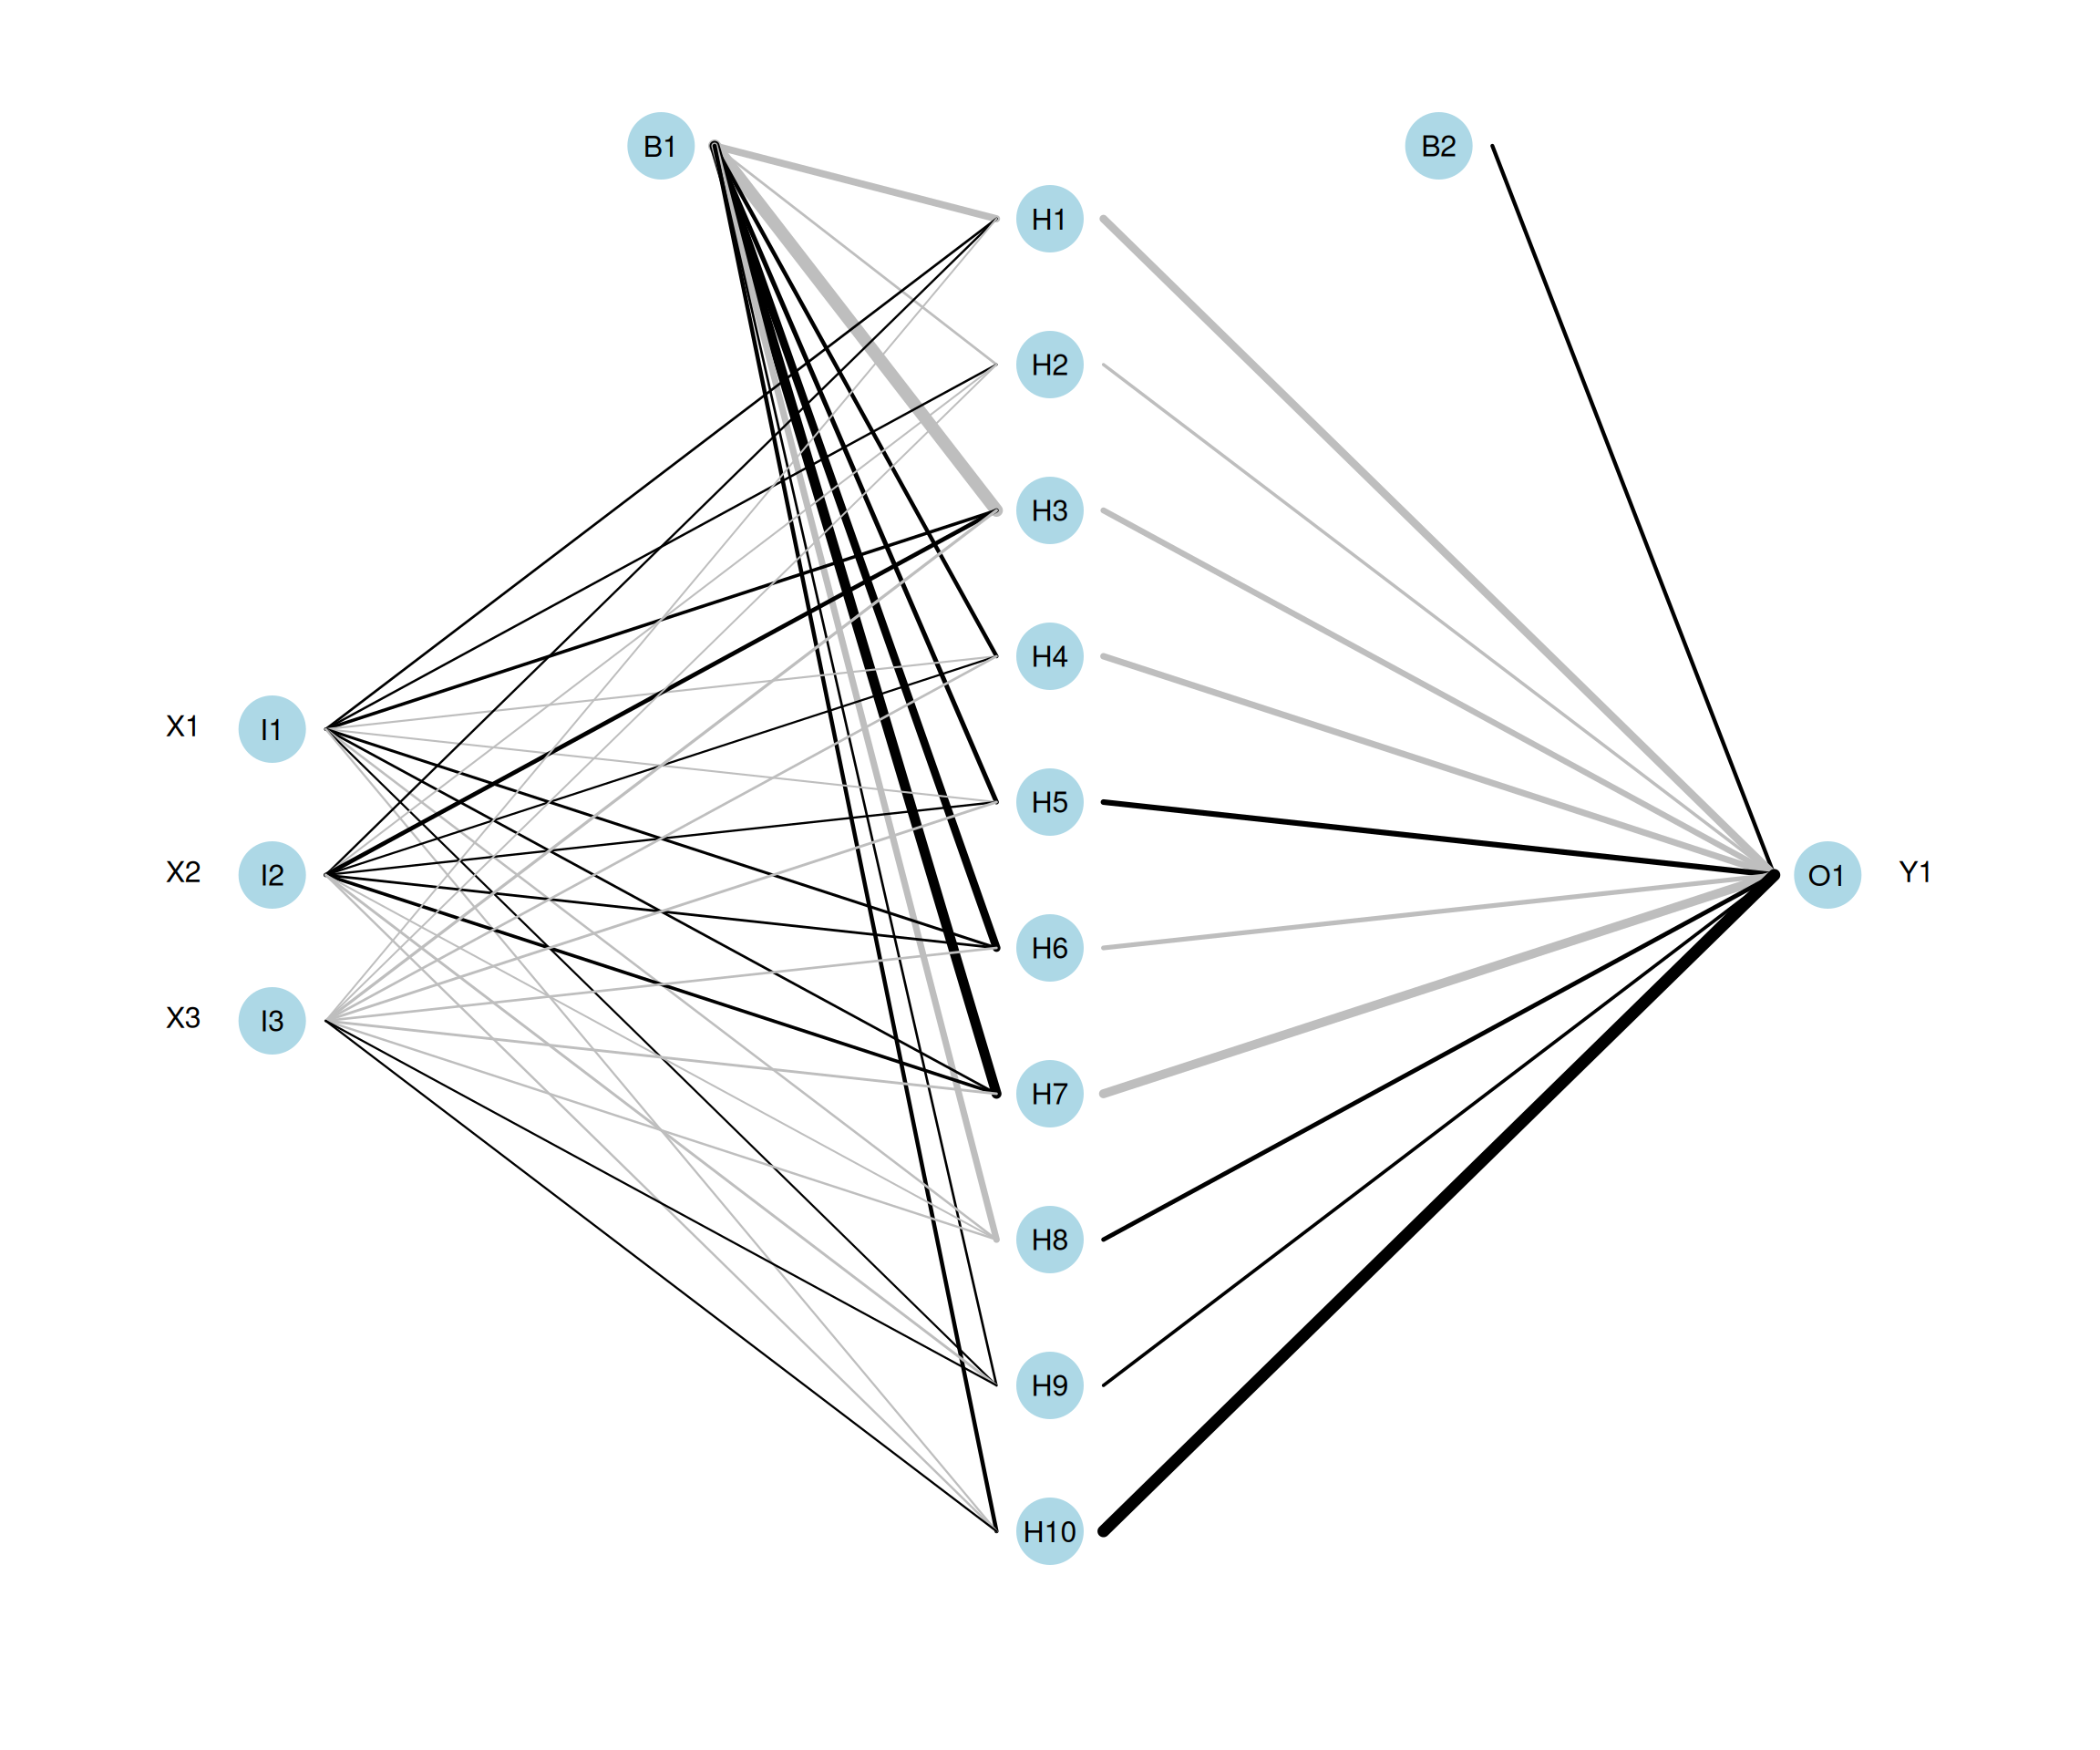
# Neural Network
mod <- nnet(Y1 ~ X1 + X2 + X3, data = neuraldat, size = 10,
            maxint = 100, decay = 0)
# weights: 51
initial value 62.651149
iter 10 value 0.298913
iter 20 value 0.183618
iter 30 value 0.140258
iter 40 value 0.085080
iter 50 value 0.030234
iter 60 value 0.022400
iter 70 value 0.009269
iter 80 value 0.007392
iter 90 value 0.004543
iter 100 value 0.003317
final value 0.003317
stopped after 100 iterations# plot
par(mar = numeric(4))
plotnet(mod)