# Install packages
if (!requireNamespace("ggmsa", quietly = TRUE)) {
  install.packages("ggmsa")
}

# Library packages
library(ggmsa)Multiple Sequences Alignment
Multiple Sequence Alignment (MSA) is a fundamental and crucial technique in bioinformatics. It is used to align three or more biological sequences (DNA, RNA, or proteins) based on their evolutionary or structural similarities, so that homologous sites (i.e., sites derived from a common ancestor) are aligned as much as possible.
Example
Setup
System Requirements: Cross-platform (Linux/MacOS/Windows)
Programming language: R
Dependent packages:
ggmsa
sessioninfo::session_info("attached")─ Session info ───────────────────────────────────────────────────────────────
setting value
version R version 4.6.0 (2026-04-24)
os Ubuntu 24.04.4 LTS
system x86_64, linux-gnu
ui X11
language (EN)
collate C.UTF-8
ctype C.UTF-8
tz UTC
date 2026-05-09
pandoc 3.1.3 @ /usr/bin/ (via rmarkdown)
quarto 1.9.37 @ /usr/local/bin/quarto
─ Packages ───────────────────────────────────────────────────────────────────
package * version date (UTC) lib source
ggmsa * 1.18.0 2026-04-28 [1] Bioconduc~
[1] /home/runner/work/_temp/Library
[2] /opt/R/4.6.0/lib/R/site-library
[3] /opt/R/4.6.0/lib/R/library
* ── Packages attached to the search path.
──────────────────────────────────────────────────────────────────────────────Data Preparation
DNA/RNA/amino acid sequence data is usually stored in FASTA format, where each sequence consists of a description line (starting with “>”) followed by sequence lines.
# Example data
protein_fasta <- system.file("extdata", "sample.fasta", package = "ggmsa")

# Data preview
seqs <- readLines(protein_fasta)
head(seqs)
[1] ">PH4H_Rattus_norvegicus"
[2] "MAAVVLENGVLSRKLSDFGQETSYIEDNSNQNGAISLIFSLKEEVGALAKVLRLFEENDINLTHIESRPSRLNKDEYEFF"
[3] "TYLDKRTKPVLGSIIKSLRNDIGATVHELSRDKEKNTVPWFPRTIQELDRFANQILSYGAELDADHPGFKDPVYRARRKQ"
[4] "FADIAYNYRHGQPIPRVEYTEEEKQTWGTVFRTLKALYKTHACYEHNHIFPLLEKYCGFREDNIPQLEDVSQFLQTCTGF"
[5] "RLRPVAGLLSSRDFLGGLAFRVFHCTQYIRHGSKPMYTPEPDICHELLGHVPLFSDRSFAQFSQEIG-LASLGAPDEYIE"
[6] "KLATIYWFTVEFGLCKEG-DSIKAYGAGLLSSFGELQYCLSD-KPKLLPLELEKTACQEYSVTEFQPLYYVAESFSDAKE"Visualization
1. Multiple sequence alignment of proteins
The visualization of multiple protein sequence alignment shows the alignment of multiple protein sequences in specific regions, helps identify conserved regions and mutation sites, and provides a professional color scheme for amino acid sequences.
# Multiple sequence alignment of proteins
p <- ggmsa(
  protein_fasta,
  start = 300,
  end = 330,
  font = "DroidSansMono",
  color = "Chemistry_AA",
  char_width = 0.5,
  seq_name = TRUE,
  consensus_views = FALSE
)

p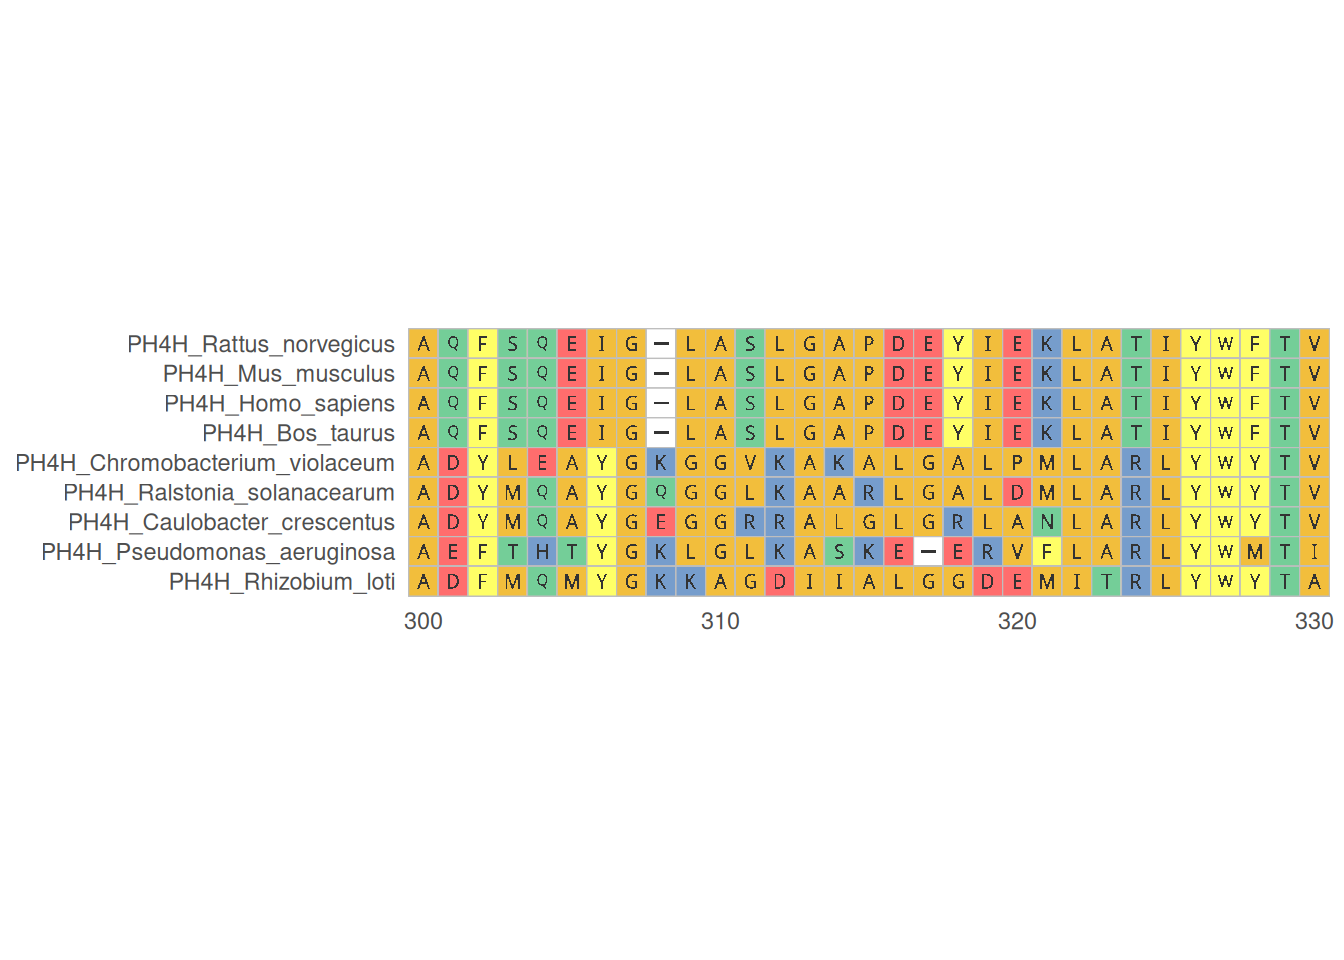
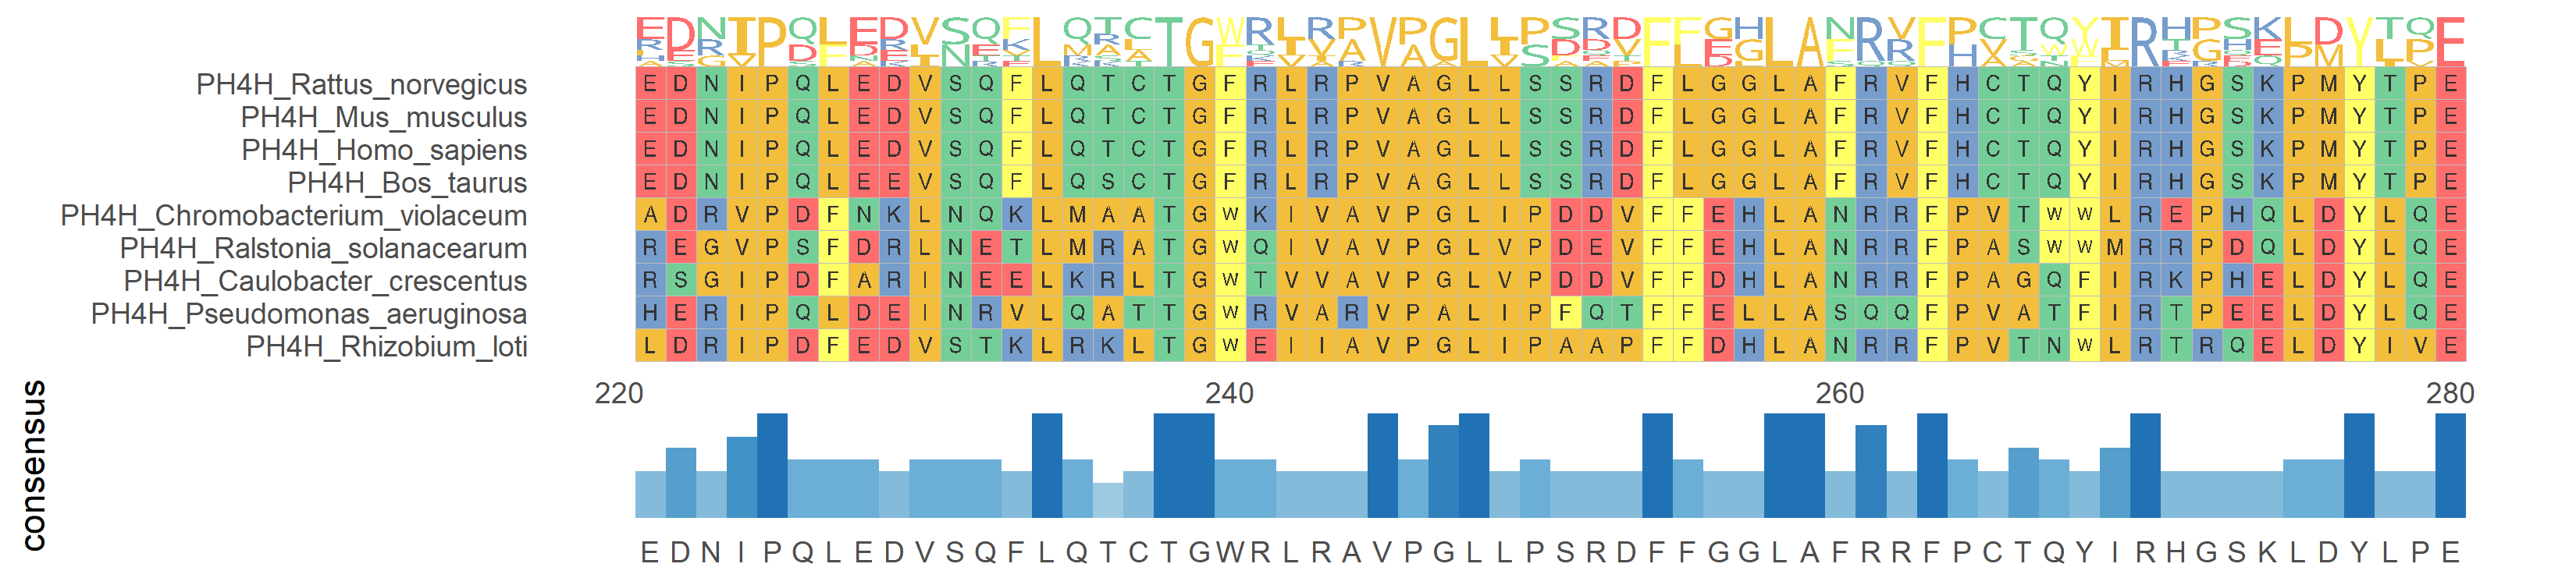
2. Multiple sequence alignment and statistics
The statistical chart of multiple sequence alignment results shows the conservation and variation of multiple sequences within the alignment region, helping to identify key sites and regions.
# Multiple sequence alignment and statistics
p <- ggmsa(
  protein_fasta,
  start = 300,
  end = 320,
  font = "DroidSansMono",
  color = "Chemistry_AA",
  char_width = 0.5,
  seq_name = TRUE,
  consensus_views = FALSE
) +
  geom_msaBar()

p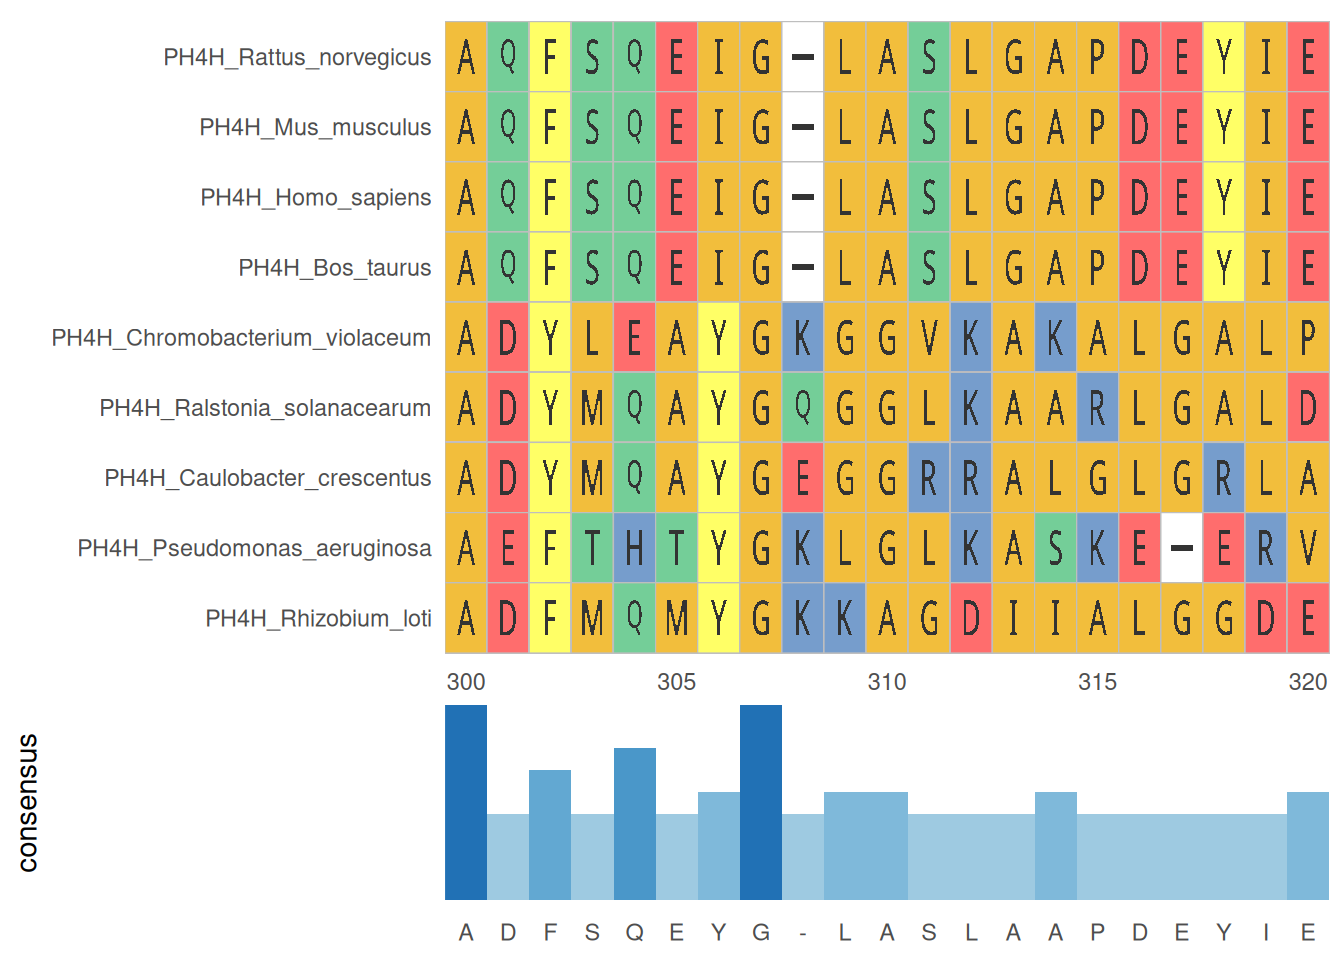
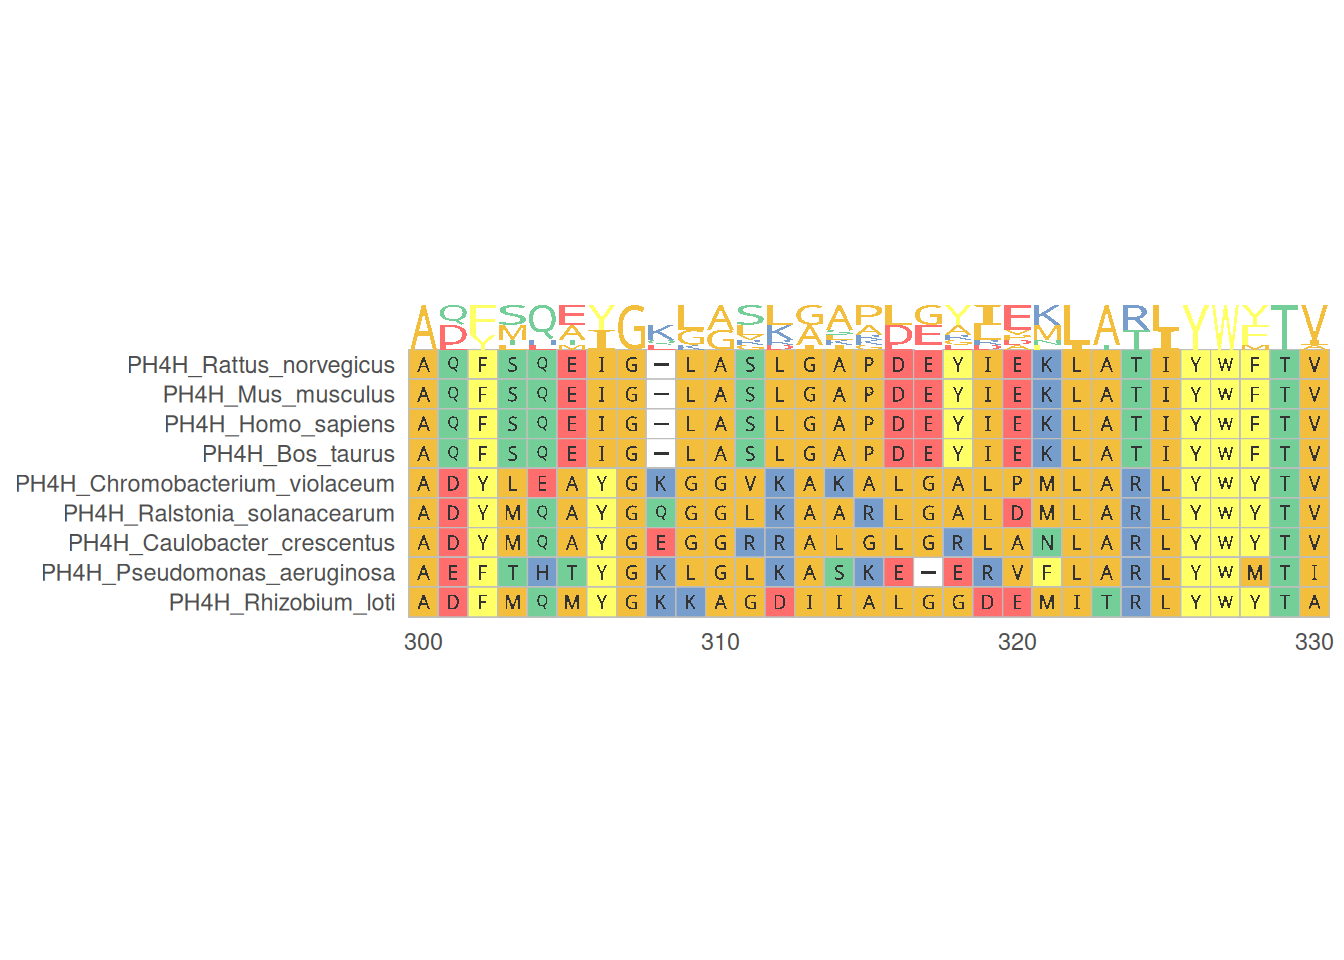
3. Multiple sequence alignment and Logo
While performing multiple sequence alignment and displaying the alignment consensus results with a Logo, the bases or amino acids of multiple sequences are sorted and displayed in the form of a Logo.
# Multiple sequence alignment and Logo
p <- ggmsa(
  protein_fasta,
  start = 300,
  end = 330,
  font = "DroidSansMono",
  color = "Chemistry_AA",
  char_width = 0.5,
  seq_name = TRUE,
  consensus_views = FALSE
) +
  geom_seqlogo()

p