# Installing packages
if (!requireNamespace("ggtern", quietly = TRUE)) {
  install.packages("ggtern", type = "source")
}
if (!requireNamespace("ggthemes", quietly = TRUE)) {
  install.packages("ggthemes")
}

# Load packages
library(ggtern)
library(ggthemes)Ternary chart
A ternary chart is a type of chart used to display the proportional relationship between three variables. These three variables typically represent a certain component (such as chemical composition, species ratio, nutritional structure, etc.), and their sum is a constant, with the most common being 1 or 100%. A ternary chart uses an equilateral triangle to represent the proportional relationship between these three variables, with each point’s position reflecting the relative proportion of these three variables. This type of chart is commonly used to observe differences in component distribution among different treatment groups, check whether samples cluster in certain regions (component preferences), compare the effects of experimental treatments on component ratios, and so on.
Example
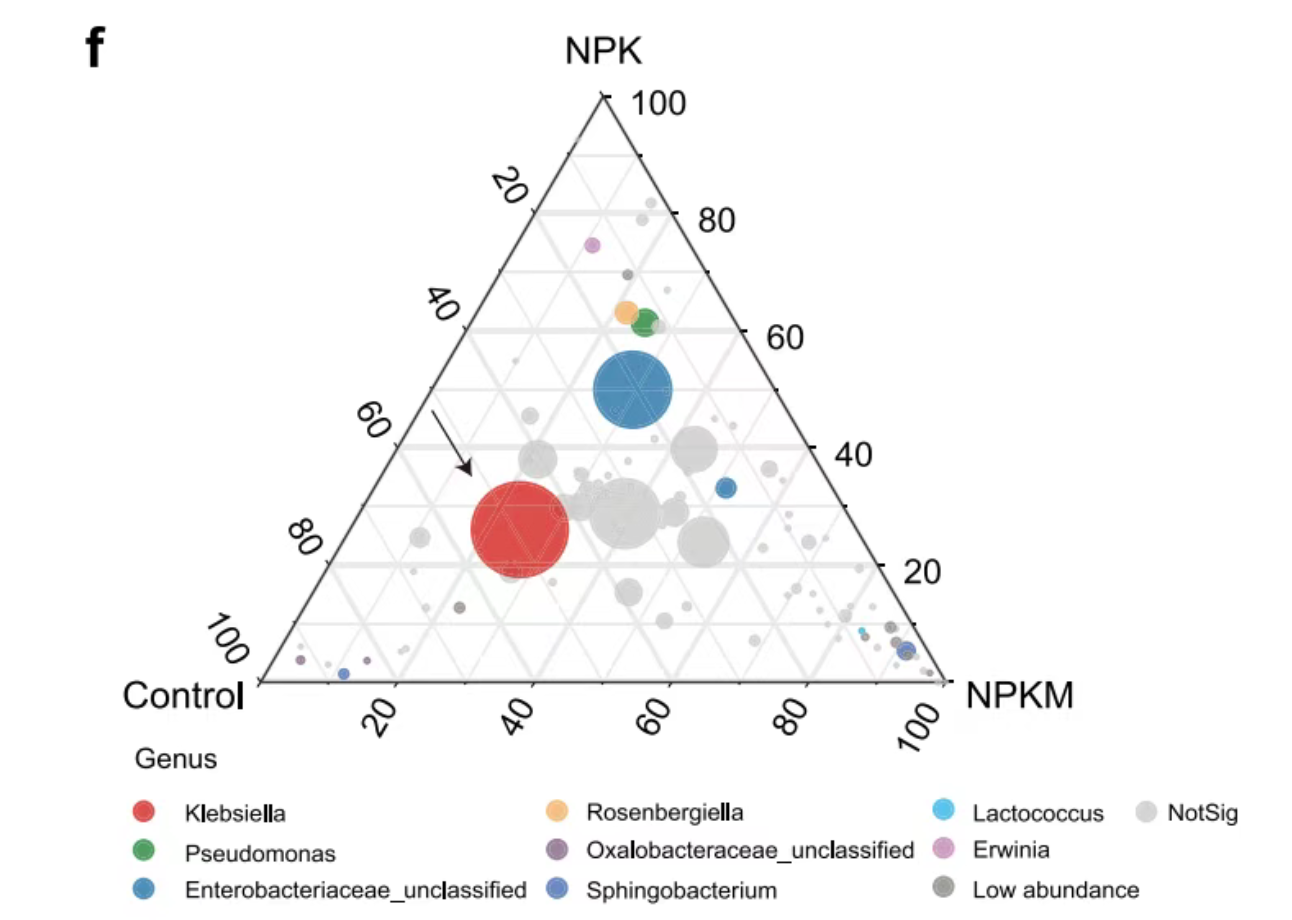
This chart shows the composition of maize bacterial communities along the soil plant continuum.
Setup
System Requirements: Cross-platform (Linux/MacOS/Windows)
Programming language: R
Dependent packages:
ggtern,ggthemes
sessioninfo::session_info("attached")─ Session info ───────────────────────────────────────────────────────────────
setting value
version R version 4.6.0 (2026-04-24)
os Ubuntu 24.04.4 LTS
system x86_64, linux-gnu
ui X11
language (EN)
collate C.UTF-8
ctype C.UTF-8
tz UTC
date 2026-05-09
pandoc 3.1.3 @ /usr/bin/ (via rmarkdown)
quarto 1.9.37 @ /usr/local/bin/quarto
──────────────────────────────────────────────────────────────────────────────Data Preparation
The data comes from the paper[1],The following is the link to the data code: https://github.com/PlantNutrition/Liyu。
# Load data
data <- read.table("https://bizard-1301043367.cos.ap-guangzhou.myqcloud.com/Tern_data.txt", header=T, row.names=1, sep="\t", comment.char = "")
# View data
head(data[,1:5])
CK NPK NPKM size Kingdom
OTU_1 4.58e-04 4.58e-04 0.000534 0.04832414 Bacteria
OTU_10 2.99e-04 2.33e-04 0.000229 0.02537028 Bacteria
OTU_10588 7.93e-05 2.47e-04 0.000171 0.01656730 Bacteria
OTU_10916 1.08e-05 9.01e-06 0.000450 0.01567026 Bacteria
OTU_11360 3.18e-03 3.17e-03 0.002610 0.29890666 Bacteria
OTU_11839 2.22e-04 4.11e-04 0.000253 0.02951640 BacteriaVisualization
1. Basic Ternary Chart
# Basic Ternary Chart
p1_1 <- ggtern(data=data, aes(x=CK, y=NPK, z=NPKM)) +
  geom_mask() +
  geom_point(aes(size=size,color=Genus),alpha=0.8)
p1_1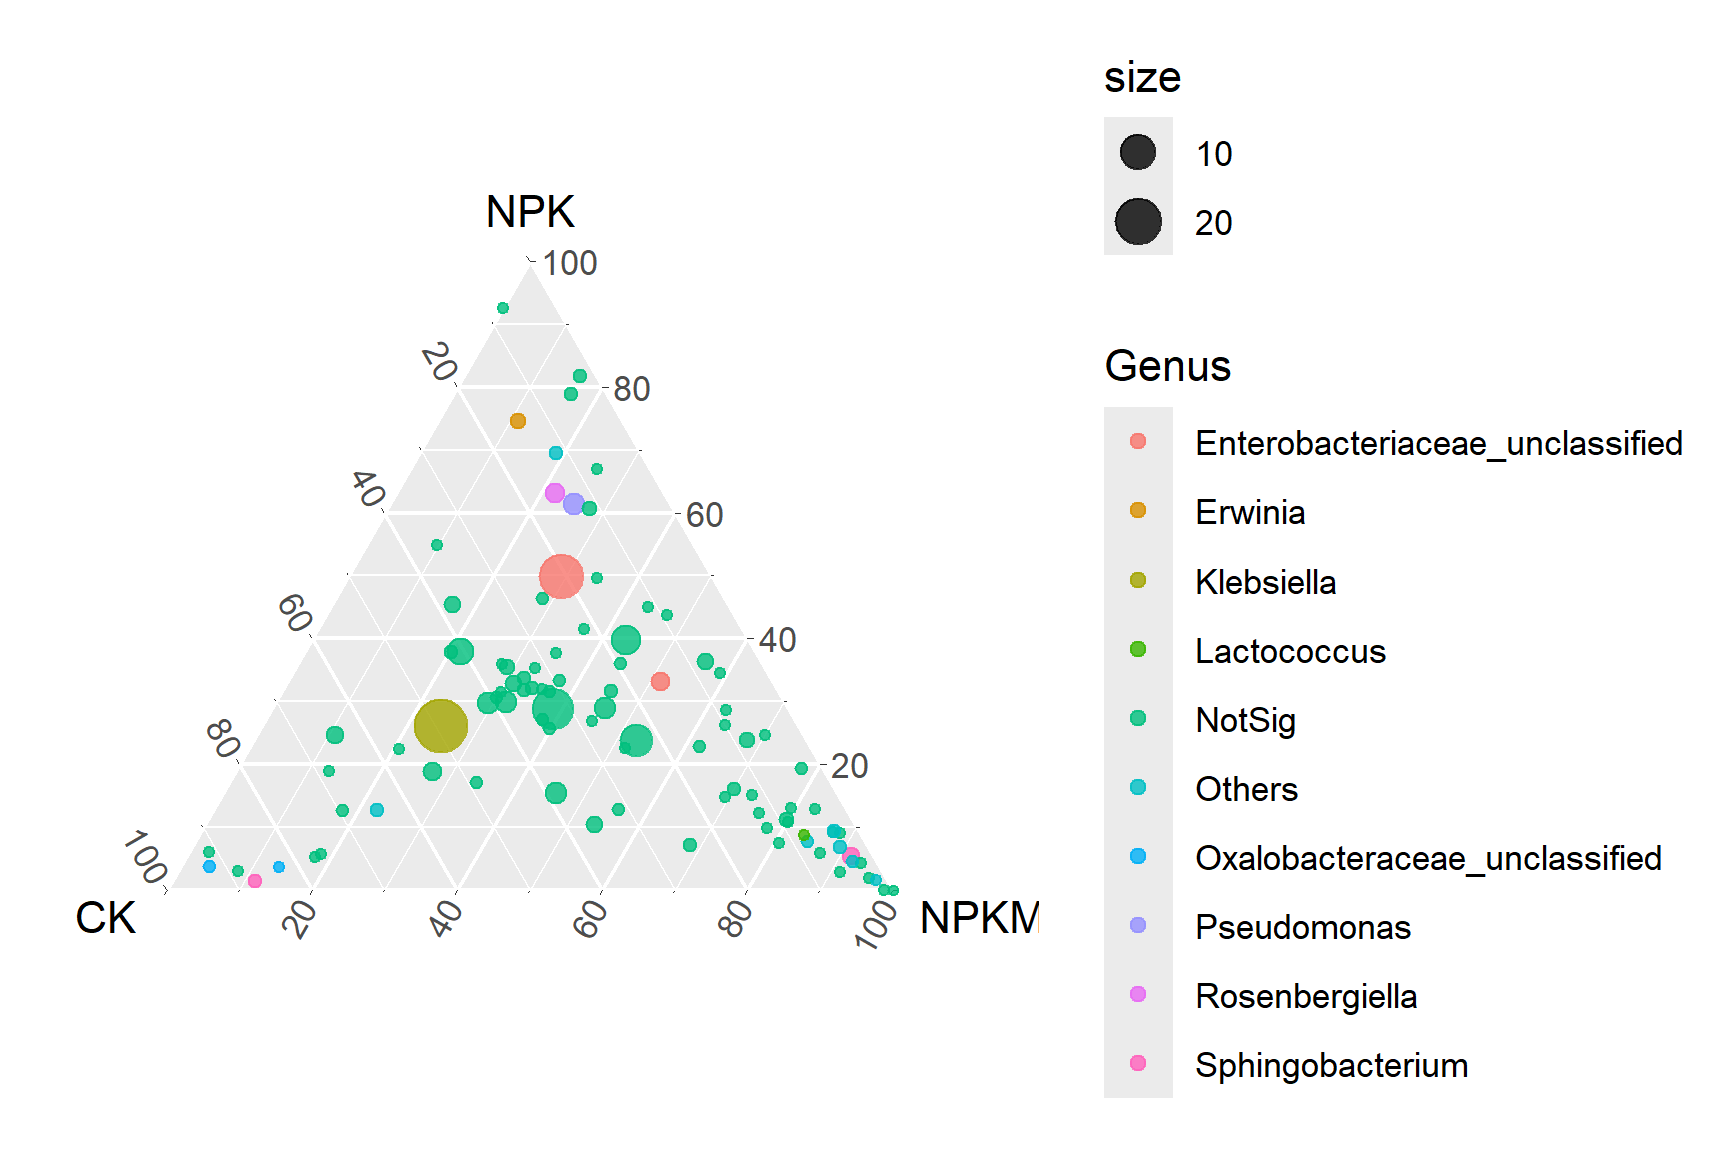
Basic Ternary Chart illustrates Ternary Chart of OTU in xylem sap under three fertilization treatments. The size of each point represents the relative abundance of OTUs.
2. Theme Change
# Theme Change
p2_1 <- ggtern(data=data, aes(x=CK, y=NPK, z=NPKM)) +
  geom_mask() +
  geom_point(aes(size=size,color=Genus),alpha=0.8) +
  theme_tropical()
p2_1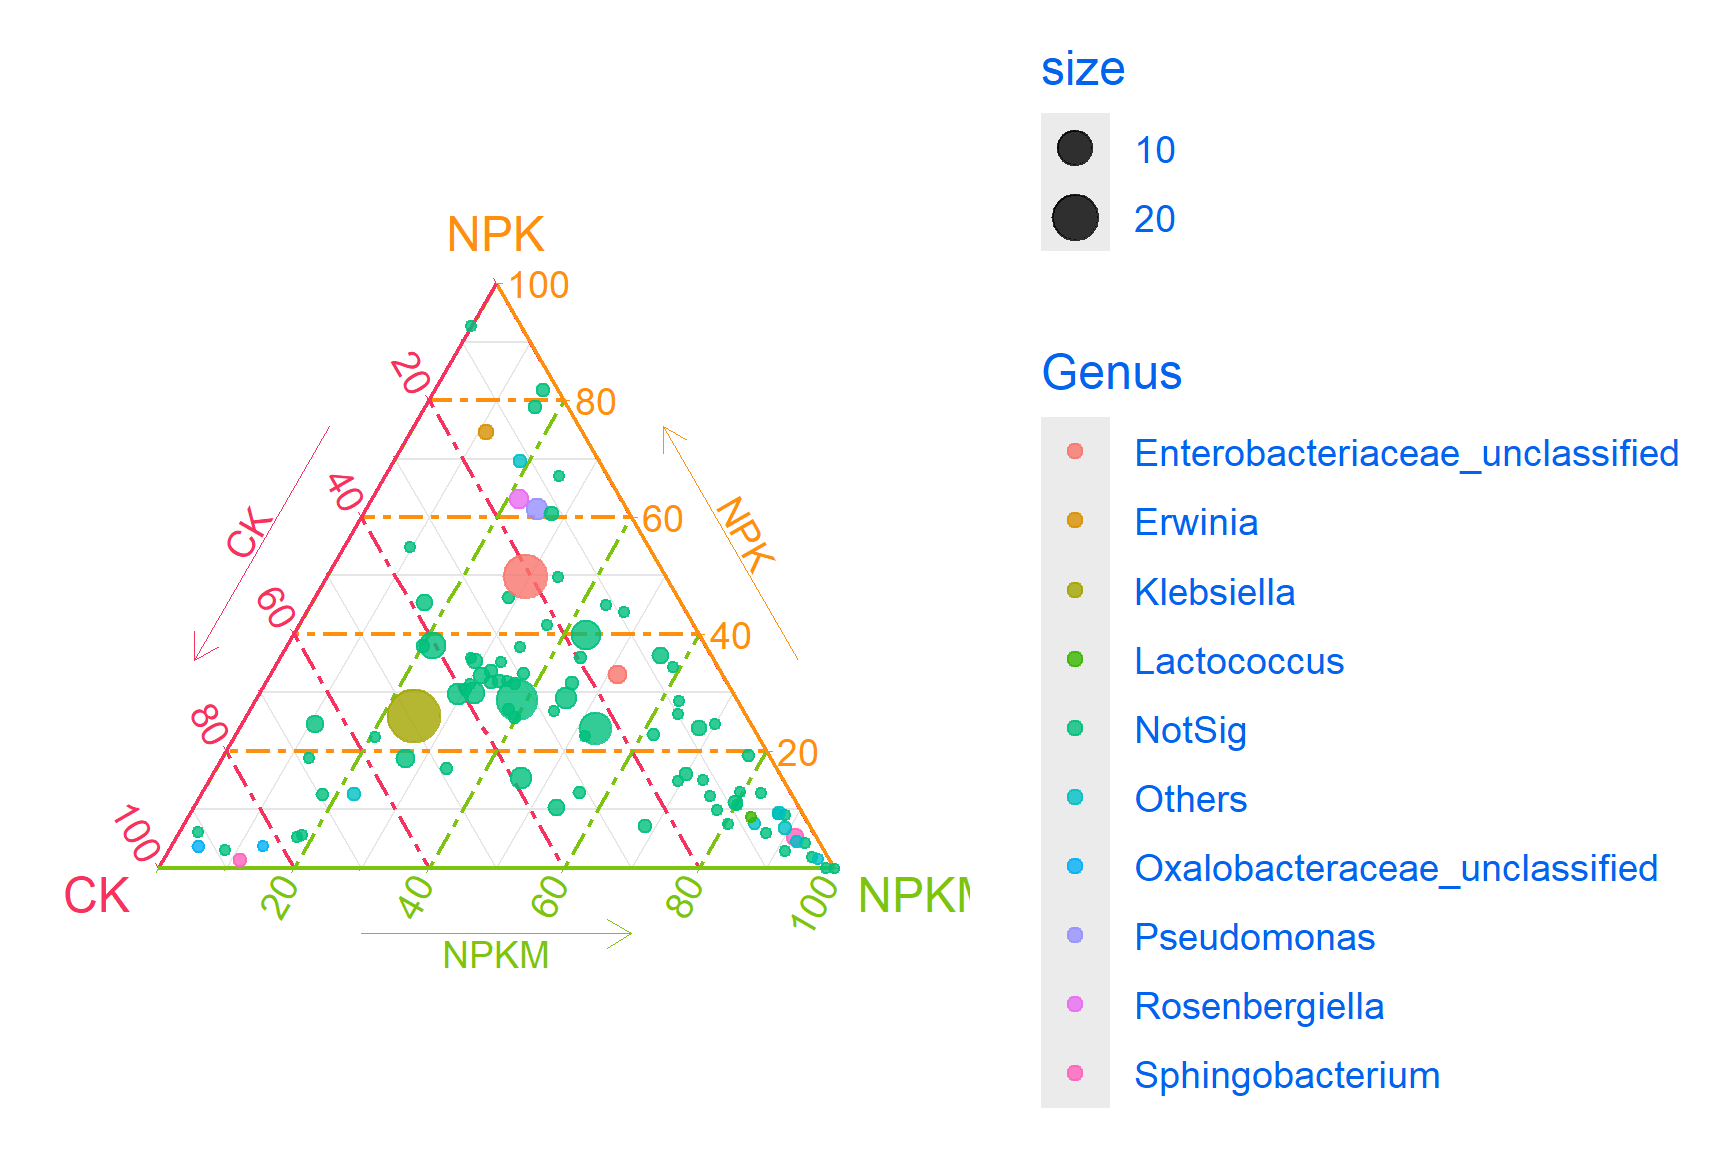
Tip
Four different themes in R language
theme_minimal:
- A simple white background, retaining the coordinate axes and light gray grid lines. No unnecessary decorations, such as background color and borders, focus on the data itself. By default, the legend background is removed and the legend title and label are directly displayed on the chart.
theme_bw:
- Black and white high contrast theme, white background with dark gray grid lines/borders. The grid lines are more prominent, suitable for black and white printing or emphasizing structured layouts. Clearer than the default theme theme_grey, with no gradient gray background.
theme_void:
- Completely blank background, remove all non data elements such as coordinate axes, gridlines, labels, titles, etc. Keep only geometric objects such as points, lines, and bars, suitable for highly customizable designs.
theme_tropical:
- Non ggplot2 built-in themes need to be implemented through extension packages such as ggthemes. Vibrant colors, common bright backgrounds and contrasting elements such as pink, blue, and green. The style is lively and suitable for informal settings.
p2_2 <- ggtern(data=data, aes(x=CK, y=NPK, z=NPKM)) +
  geom_mask() +
  geom_point(aes(size=size,color=Genus),alpha=0.8) +
  theme_bw()
p2_2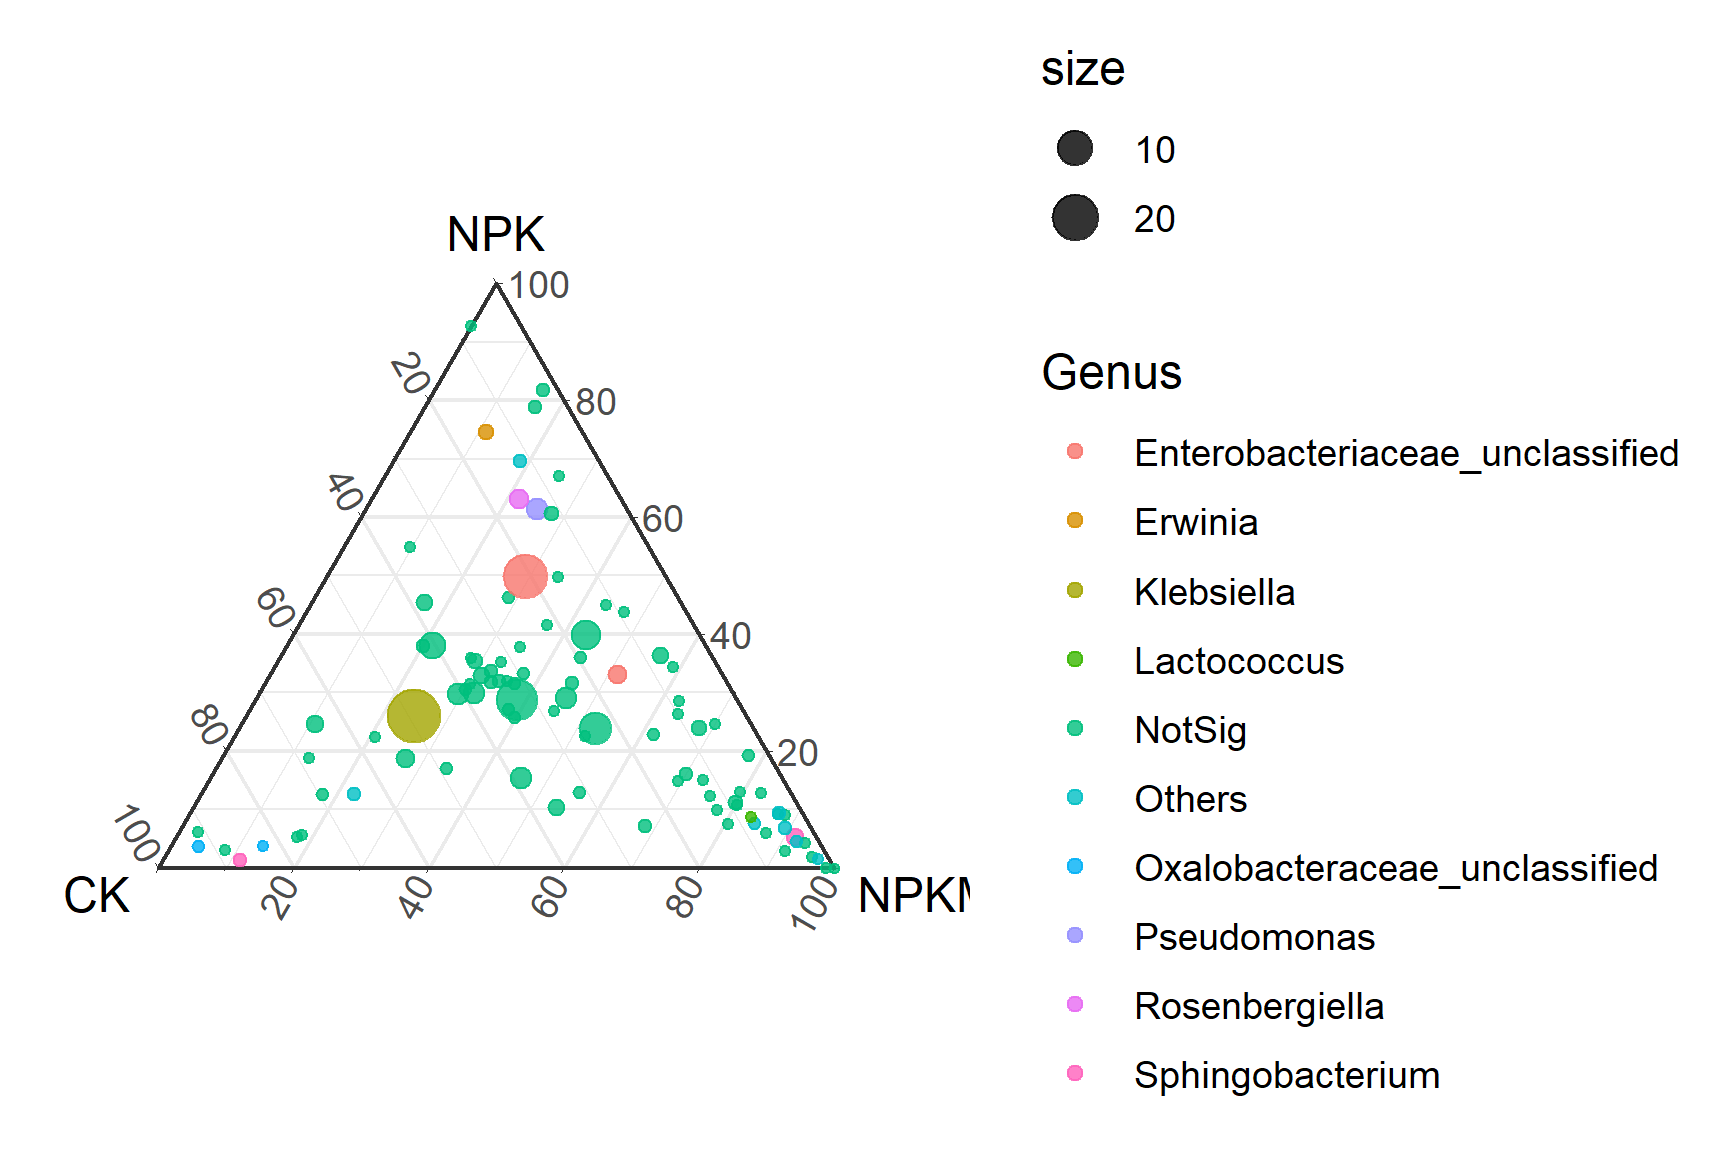
3. Beautify plots
p3_1 <- ggtern(data=data, aes(x=CK, y=NPK, z=NPKM)) +
  geom_mask() +
  geom_point(aes(size=size,color=Genus),alpha=0.8)+
  scale_size(range=c(0,10))+
  scale_color_manual(values=c('#E31A1C','#228B22','#1F78B4','#FDB462','#8B658B','#4876FF','#00BFFF','#EE82EE','#8B8682','#CDC9C9'),limits=c('Klebsiella','Pseudomonas','Enterobacteriaceae_unclassified','Rosenbergiella','Oxalobacteraceae_unclassified','Sphingobacterium','Lactococcus','Erwinia','Others','NotSig'))+
  guides(size="none")+theme_bw()+
  theme(axis.text=element_blank(),axis.ticks=element_blank())+
  theme_showarrows()
p3_1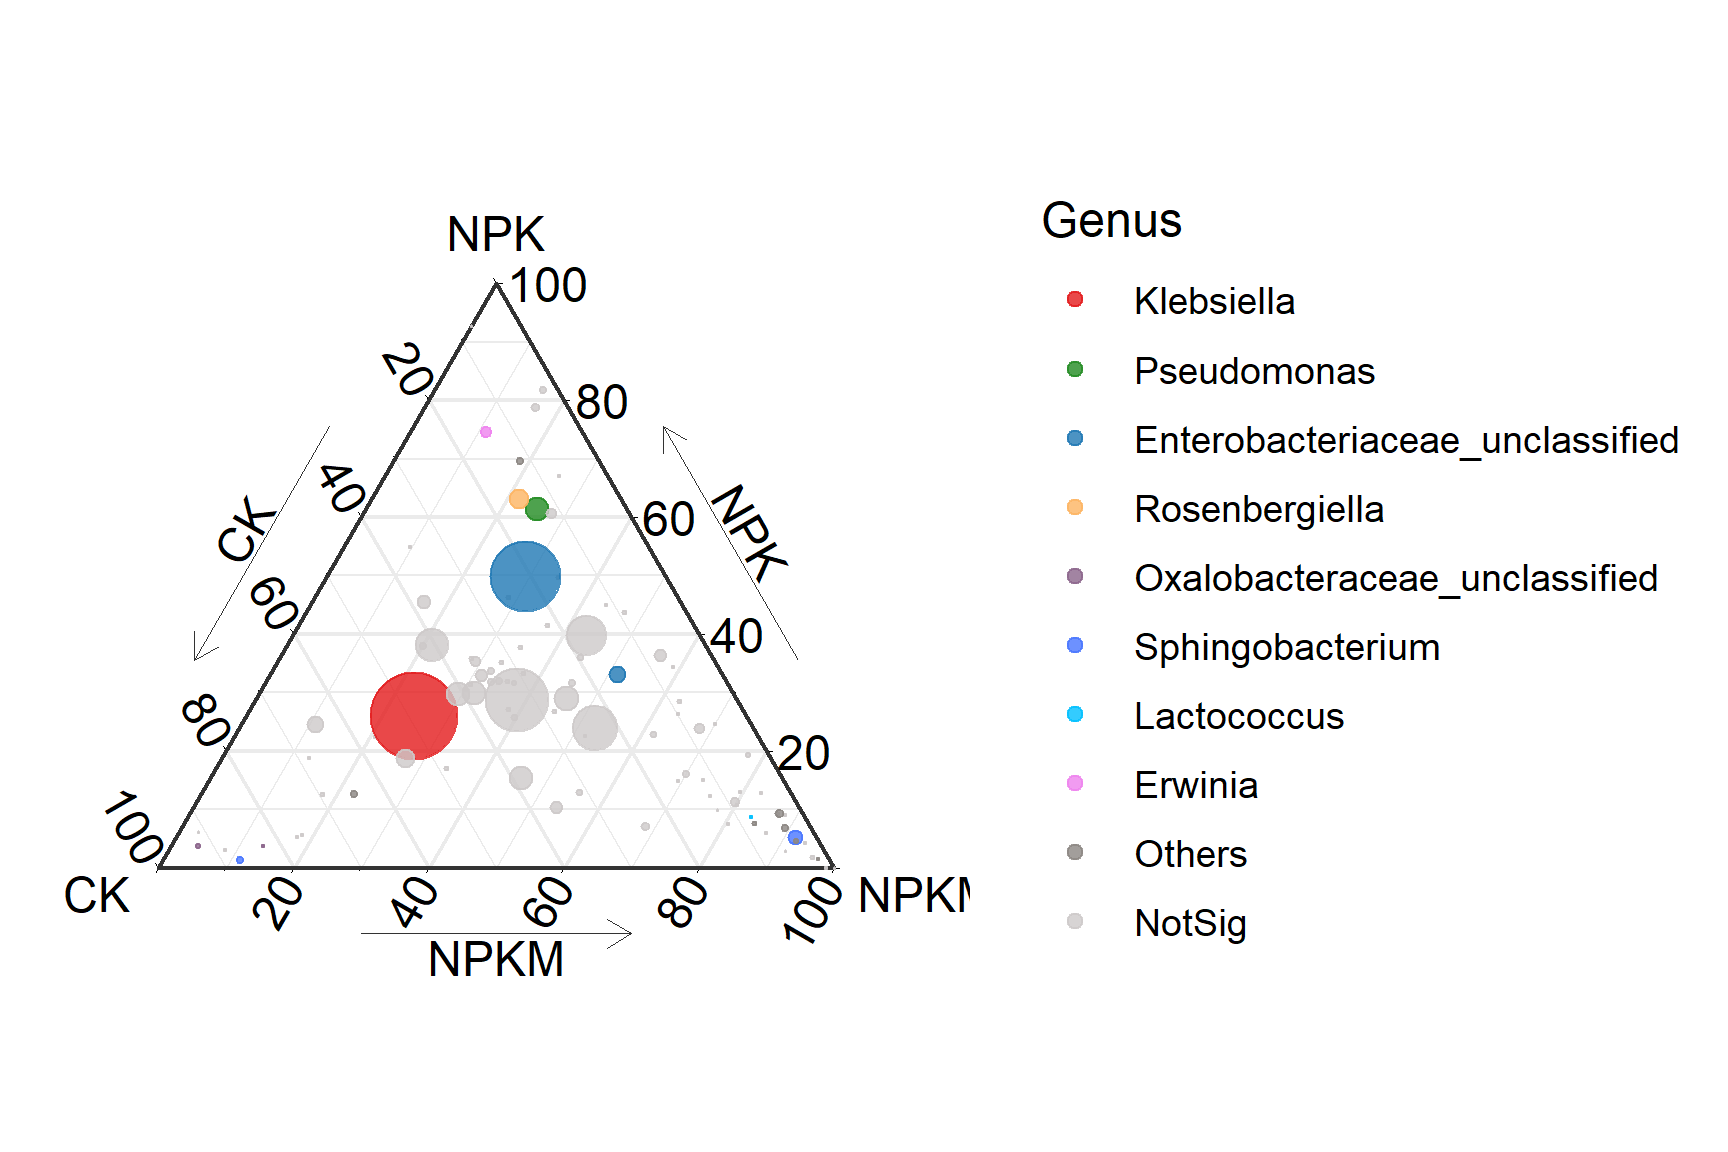
Tip
Key Parameters: Adjusting Parameters
geom_mask: Display boundary pointsscale_color_manual: Fill colortheme_showarrows: Add Arrow
Applications
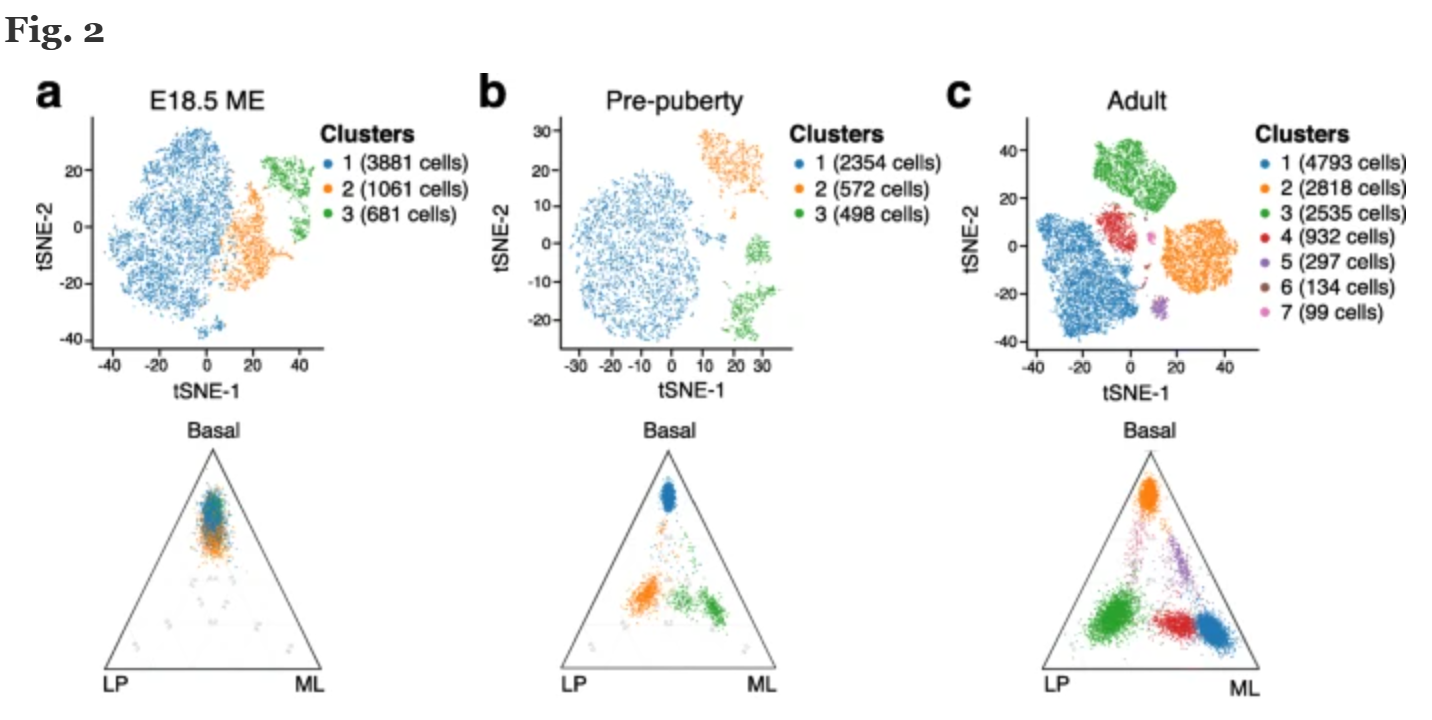
The three corners represent three subpopulations of epithelial cells, corresponding to basal cells, luminal progenitor cells (LP), and mature luminal cells (ML), respectively. From the figure, it can be seen that the cell type composition and differentiation at different stages, as well as the subpopulation status corresponding to clusters.
Reference
[1] Zhang L, Zhang M, Huang S, Li L, Gao Q, Wang Y, Zhang S, Huang S, Yuan L, Wen Y, Liu K, Yu X, Li D, Zhang L, Xu X, Wei H, He P, Zhou W, Philippot L, Ai C. A highly conserved core bacterial microbiota with nitrogen-fixation capacity inhabits the xylem sap in maize plants. Nat Commun. 2022 Jun 11;13(1):3361. doi: 10.1038/s41467-022-31113-w. PMID: 35688828; PMCID: PMC9187771.
[2] Pal B, Chen Y, Milevskiy MJG, Vaillant F, Prokopuk L, Dawson CA, Capaldo BD, Song X, Jackling F, Timpson P, Lindeman GJ, Smyth GK, Visvader JE. Single cell transcriptome atlas of mouse mammary epithelial cells across development. Breast Cancer Res. 2021 Jun 29;23(1):69. doi: 10.1186/s13058-021-01445-4. PMID: 34187545; PMCID: PMC8243869.
[3] Hamilton, N. E., & Ferry, M. (2018). ggtern: Ternary Diagrams Using ggplot2 [R package]. https://CRAN.R-project.org/package=ggtern
[4] Arnold, J. (2024). ggthemes: Extra Themes, Scales and Geoms for ‘ggplot2’ [R package]. https://CRAN.R-project.org/package=ggthemes