# 安装包
if (!requireNamespace("data.table", quietly = TRUE)) {
  install.packages("data.table")
}
if (!requireNamespace("jsonlite", quietly = TRUE)) {
  install.packages("jsonlite")
}
if (!requireNamespace("scatterpie", quietly = TRUE)) {
  install.packages("scatterpie")
}

# 加载包
library(data.table)
library(jsonlite)
library(scatterpie)散点饼图
注记
Hiplot 网站
本页面为 Hiplot Scatterpie 插件的源码版本教程,您也可以使用 Hiplot 网站实现无代码绘图,更多信息请查看以下链接:
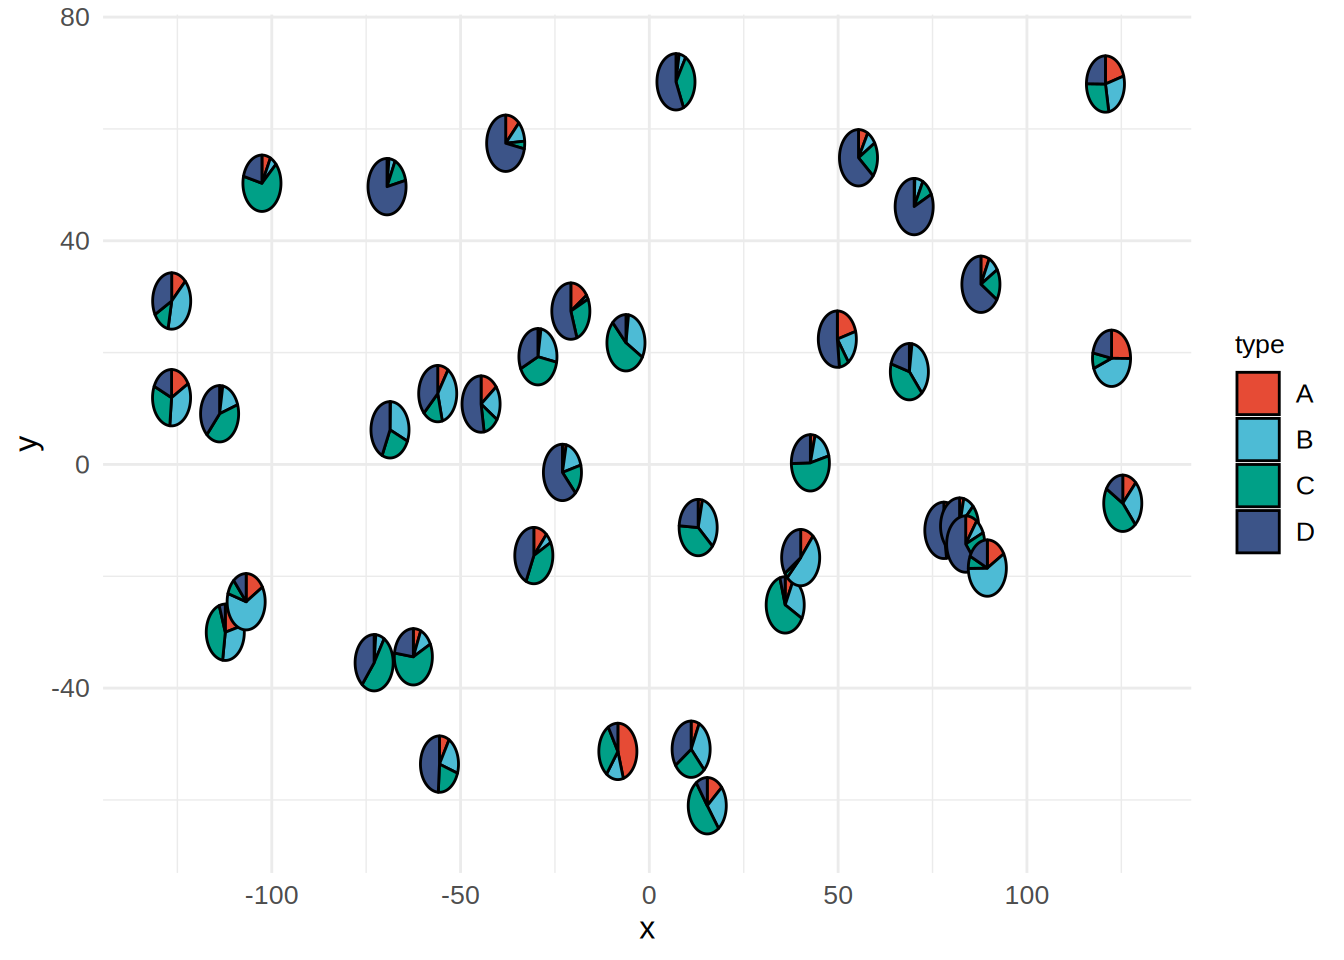
散点饼图用于可视化不同空间坐标中数据分类值的比例情况。
环境配置
系统: Cross-platform (Linux/MacOS/Windows)
编程语言: R
依赖包:
data.table;jsonlite;scatterpie
sessioninfo::session_info("attached")─ Session info ───────────────────────────────────────────────────────────────
setting value
version R version 4.6.0 (2026-04-24)
os Ubuntu 24.04.4 LTS
system x86_64, linux-gnu
ui X11
language (EN)
collate C.UTF-8
ctype C.UTF-8
tz UTC
date 2026-05-09
pandoc 3.1.3 @ /usr/bin/ (via rmarkdown)
quarto 1.9.37 @ /usr/local/bin/quarto
─ Packages ───────────────────────────────────────────────────────────────────
package * version date (UTC) lib source
data.table * 1.18.4 2026-05-06 [1] RSPM
ggplot2 * 4.0.3.9000 2026-05-04 [1] Github (tidyverse/ggplot2@6870419)
jsonlite * 2.0.0 2025-03-27 [1] RSPM
scatterpie * 0.2.6 2025-09-12 [1] RSPM
[1] /home/runner/work/_temp/Library
[2] /opt/R/4.6.0/lib/R/site-library
[3] /opt/R/4.6.0/lib/R/library
* ── Packages attached to the search path.
──────────────────────────────────────────────────────────────────────────────数据准备
# 加载数据
data <- data.table::fread(jsonlite::read_json("https://hiplot.cn/ui/basic/scatterpie/data.json")$exampleData$textarea[[1]])
data <- as.data.frame(data)

# 查看数据
head(data)
x y A B C D
1 -56.047565 12.665926 0.71040656 2.887786 1.309570 2.892264
2 -23.017749 -1.427338 0.25688371 1.403569 1.375096 4.945092
3 7.050839 68.430114 0.24669188 0.524395 3.189978 5.138863
4 12.928774 -11.288549 0.34754260 3.144288 3.789556 2.295894
5 -126.506123 29.230687 0.95161857 3.029335 1.048951 2.471943
6 -68.685285 6.192712 0.04502772 3.203072 2.596539 4.439393可视化
# 散点饼图
p <- ggplot() +
  geom_scatterpie(data = data, aes(x = x, y = y), cols = colnames(data)[-c(1, 2)]) +
  scale_fill_manual(values = c("#E64B35FF","#4DBBD5FF","#00A087FF","#3C5488FF")) +
  labs(x="x", y="y") +
  theme_minimal() +
  theme(text = element_text(family = "Arial"),
        plot.title = element_text(size = 12,hjust = 0.5),
        axis.title = element_text(size = 12),
        axis.text = element_text(size = 10),
        axis.text.x = element_text(angle = 0, hjust = 0.5,vjust = 1),
        legend.position = "right",
        legend.direction = "vertical",
        legend.title = element_text(size = 10),
        legend.text = element_text(size = 10))

p