import matplotlib.pyplot as plt
import scanpy as sc
import pandas as pd
import numpy as np

sc.settings.verbosity = 0
sc.settings.set_figure_params(dpi=90, facecolor='white')单细胞点图(Python)
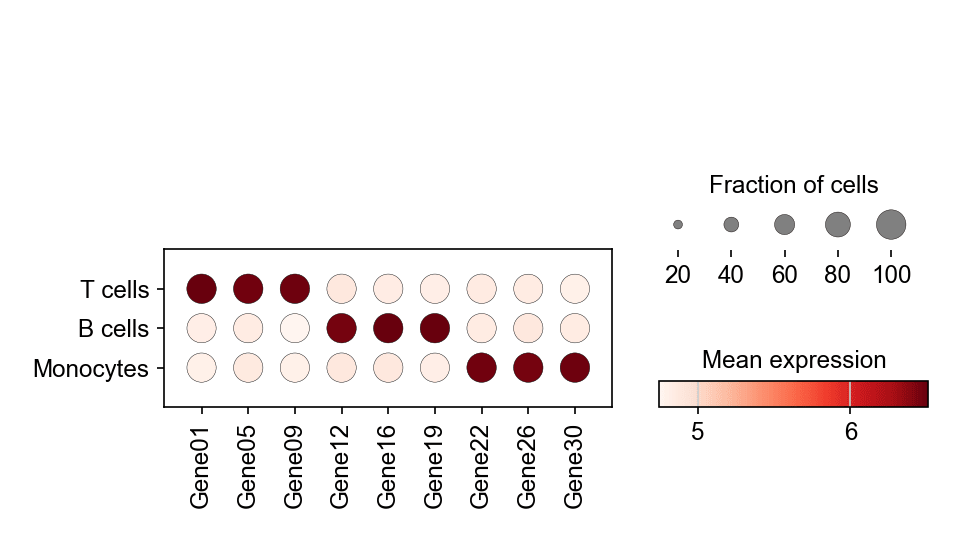
单细胞点图把标志基因在多个 cluster 上的表达概括进一张密集面板:点大小编码表达该基因的细胞比例,点颜色编码平均表达水平。它是 scRNA-seq 论文中「哪些标志基因定义哪个 cluster」的标准汇总。scanpy.pl.dotplot 直接从数据对象计算两种编码。
示例
环境配置
- 系统要求:跨平台(Linux/MacOS/Windows)
- 编程语言:Python
- 依赖包:
scanpy、anndata、pandas、numpy、matplotlib
数据准备
我们复用模拟的三群体 PBMC 数据集,用 rank_genes_groups 找出每个 cluster 的头部标志基因,再保留一组覆盖全部群体的精选基因。
np.random.seed(241)

n_per = 400
genes = [f'Gene{i:02d}' for i in range(1, 31)]
blocks = {'T cells': (0, 10), 'B cells': (10, 20), 'Monocytes': (20, 30)}
counts = np.zeros((n_per * 3, 30))
labels = []
for i, (cell_type, (lo, hi)) in enumerate(blocks.items()):
    sl = slice(i * n_per, (i + 1) * n_per)
    counts[sl] = np.random.negative_binomial(4, 0.3, (n_per, 30))
    counts[sl, lo:hi] += np.random.negative_binomial(8, 0.2, (n_per, hi - lo))
    labels += [cell_type] * n_per

adata = sc.AnnData(counts.astype(np.float32))
adata.var_names = genes
adata.obs['CellType'] = pd.Categorical(labels, categories=blocks)

sc.pp.normalize_total(adata, target_sum=1e4)
sc.pp.log1p(adata)
sc.tl.rank_genes_groups(adata, 'CellType')
marker_genes = ['Gene01', 'Gene05', 'Gene09',
                'Gene12', 'Gene16', 'Gene19',
                'Gene22', 'Gene26', 'Gene30']
可视化
精选标志基因点图
var_names 固定基因顺序,dendrogram=False 保持生物学分组显式;尺寸图例解释比例编码。
fig, ax = plt.subplots(figsize=(6.4, 3.6))
sc.pl.dotplot(adata, var_names=marker_genes, groupby='CellType',
              ax=ax, show=False, cmap='Reds',
              size_title='Fraction of cells', colorbar_title='Mean expression')
plt.tight_layout()
plt.show()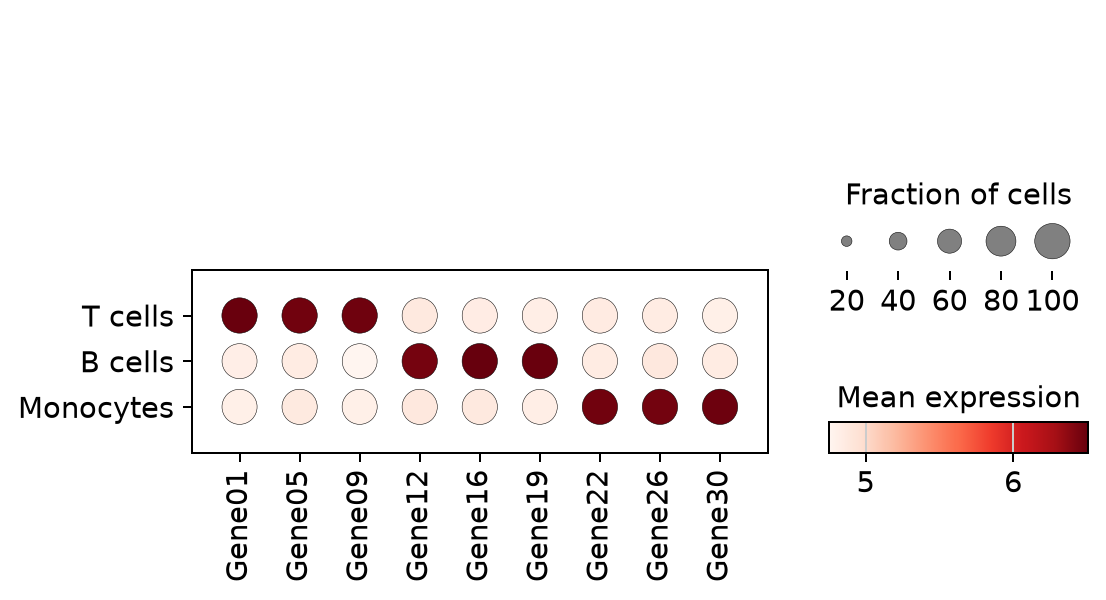
逐 cluster 的排序标志基因
不做手工挑选,直接取每个 cluster 排名前三的基因——rank_genes_groups 之后的快速浏览版本。
rg = sc.get.rank_genes_groups_df(adata, group=None)
ranked = sorted(set(rg.names.head(9)))
fig, ax = plt.subplots(figsize=(6.4, 3.2))
sc.pl.dotplot(adata, var_names=ranked, groupby='CellType',
              ax=ax, show=False, cmap='Reds',
              size_title='Fraction of cells', colorbar_title='Mean expression')
plt.tight_layout()
plt.show()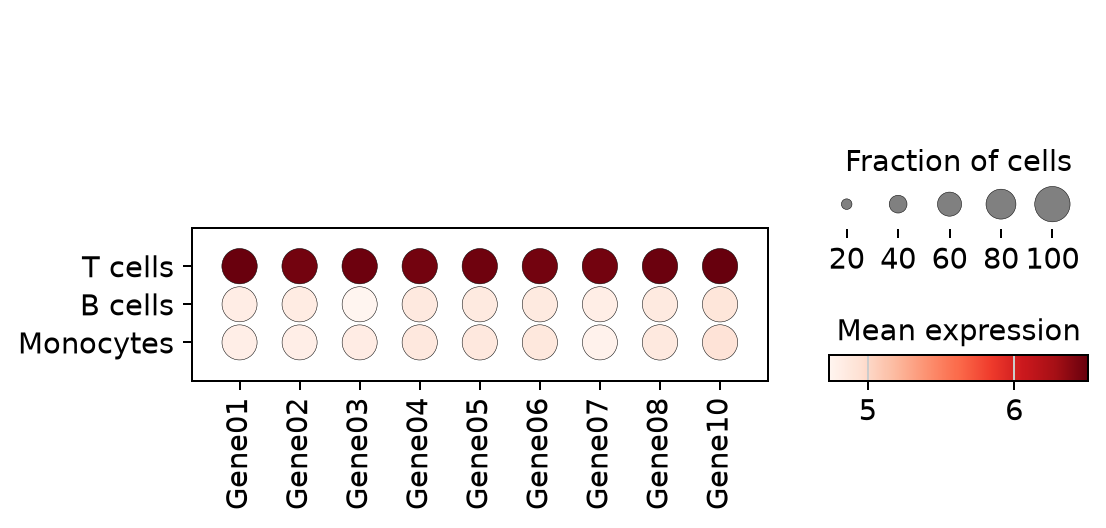
参考文献
- Wolf, F. A., Angerer, P., & Theis, F. J. (2018). SCANPY: large-scale single-cell gene expression data analysis. Genome Biology, 19, 15.
- Trapnell, C. (2015). Defining cell types and states with single-cell genomics. Genome Research, 25(10), 1491-1498.