# 安装包
if (!requireNamespace("data.table", quietly = TRUE)) {
  install.packages("data.table")
}
if (!requireNamespace("jsonlite", quietly = TRUE)) {
  install.packages("jsonlite")
}
if (!requireNamespace("shape", quietly = TRUE)) {
  install.packages("shape")
}
if (!requireNamespace("ggplotify", quietly = TRUE)) {
  install.packages("ggplotify")
}

# 加载包
library(data.table)
library(jsonlite)
library(shape)
library(ggplotify)透视图
注记
Hiplot 网站
本页面为 Hiplot Perspective 插件的源码版本教程,您也可以使用 Hiplot 网站实现无代码绘图,更多信息请查看以下链接:
三维透视图是一种能将一个矩阵中包含的高等数值用曲面连接起来的三维立体图形。
环境配置
系统: Cross-platform (Linux/MacOS/Windows)
编程语言: R
依赖包:
data.table;jsonlite;shape;ggplotify
sessioninfo::session_info("attached")─ Session info ───────────────────────────────────────────────────────────────
setting value
version R version 4.6.0 (2026-04-24)
os Ubuntu 24.04.4 LTS
system x86_64, linux-gnu
ui X11
language (EN)
collate C.UTF-8
ctype C.UTF-8
tz UTC
date 2026-05-09
pandoc 3.1.3 @ /usr/bin/ (via rmarkdown)
quarto 1.9.37 @ /usr/local/bin/quarto
─ Packages ───────────────────────────────────────────────────────────────────
package * version date (UTC) lib source
data.table * 1.18.4 2026-05-06 [1] RSPM
ggplotify * 0.1.3 2025-09-20 [1] RSPM
jsonlite * 2.0.0 2025-03-27 [1] RSPM
shape * 1.4.6.1 2024-02-23 [1] RSPM
[1] /home/runner/work/_temp/Library
[2] /opt/R/4.6.0/lib/R/site-library
[3] /opt/R/4.6.0/lib/R/library
* ── Packages attached to the search path.
──────────────────────────────────────────────────────────────────────────────数据准备
载入数据为一个矩阵。
# 加载数据
data <- data.table::fread(jsonlite::read_json("https://hiplot.cn/ui/basic/perspective/data.json")$exampleData$textarea[[1]])
data <- as.data.frame(data)

# 整理数据格式
data <- as.matrix(data)
col <- drapecol(data)

# 查看数据
head(data[,1:5])
V1 V2 V3 V4 V5
[1,] 100 101 102 103 104
[2,] 100 101 102 103 104
[3,] 101 102 103 104 105
[4,] 101 102 103 104 105
[5,] 101 102 103 104 105
[6,] 101 102 103 104 105可视化
# 透视图
p <- as.ggplot(function() {
  persp(as.matrix(data),
    theta = 45, phi = 20,
    expand = 0.5,
    r = 180, col = col,
    ltheta = 120,
    shade = 0.5,
    ticktype = "detailed",
    xlab = "X", ylab = "Y", zlab = "Z",
    border = "black" # could be NA
  )
  title("Perspective Plot", line = 0)
})

p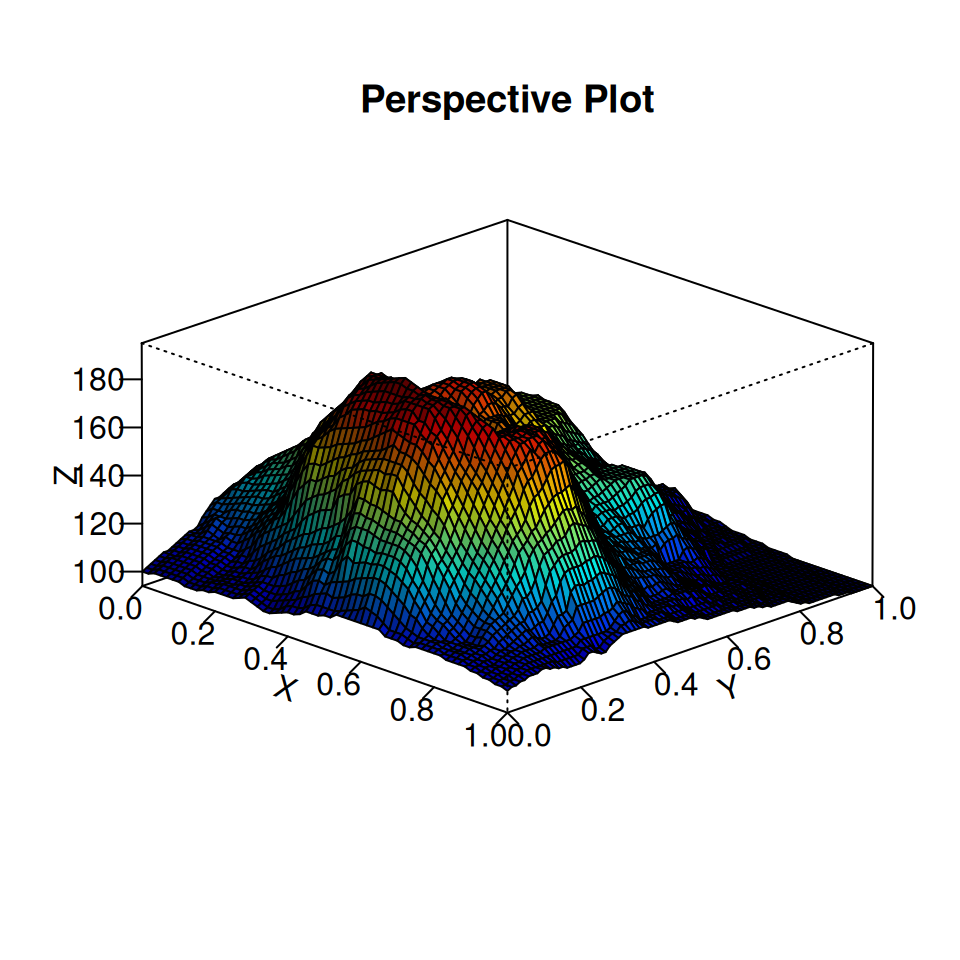
清晰观测一个山峰的全貌。