import matplotlib.pyplot as plt
import seaborn as sns
import pandas as pd
import numpy as np折线图(Python)
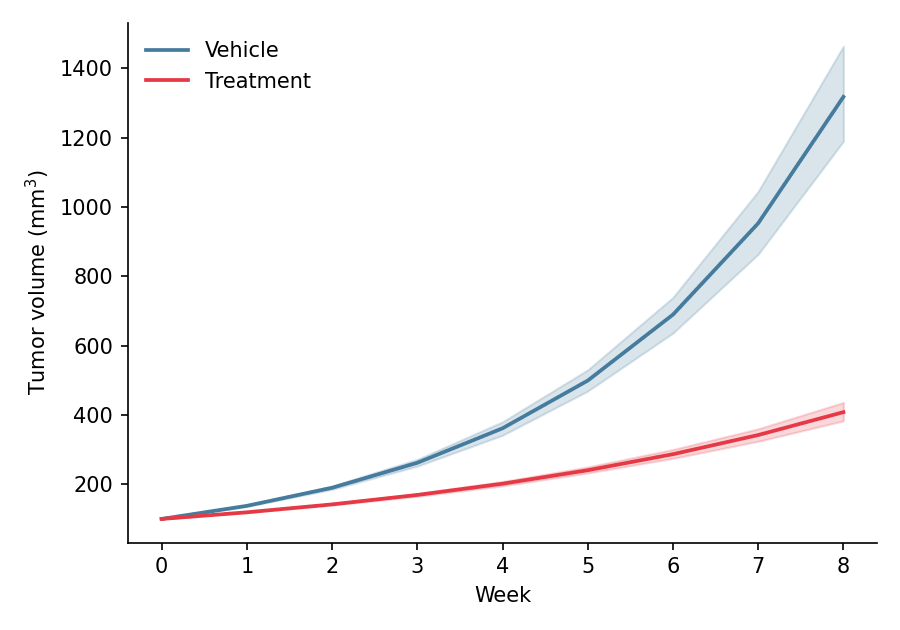
折线图展示连续变量沿有序轴(通常是时间)的趋势。在生物医学研究中,折线图是生长曲线、药代动力学轮廓和纵向组学时间序列的标准图形,通常在组均值周围附上不确定性带。Python 的 seaborn 只需一次调用即可将重复测量聚合为均值线与置信带,matplotlib 则提供更精细的样式控制。
示例
环境配置
- 系统要求:跨平台(Linux/MacOS/Windows)
- 编程语言:Python
- 依赖包:
matplotlib、seaborn、pandas、numpy
数据准备
我们模拟一项临床前肿瘤生长实验:两个处理臂(Vehicle 与 Treatment)各 12 只小鼠,连续 8 周每周测量一次,采用带小鼠间变异的两相指数生长模型。
np.random.seed(21)

weeks = np.arange(0, 9)
n_mice = 12
records = []
for arm, growth_rate in [('Vehicle', 0.32), ('Treatment', 0.18)]:
    for mouse in range(n_mice):
        size = 100 * np.exp(growth_rate * np.random.normal(1, 0.08) * weeks)
        records.append(pd.DataFrame({
            'Week': weeks,
            'Size': size,
            'Arm': arm,
            'Mouse': f'{arm[:2]}_{mouse:02d}'
        }))
tumor = pd.concat(records, ignore_index=True)
可视化
基础折线图
先聚合再绘图:每组一条线并配以不同 marker,使小型汇总图保持易读。
mean_size = tumor.groupby(['Arm', 'Week'], as_index=False)['Size'].mean()

plt.figure(figsize=(6, 4.2))
ax = sns.lineplot(data=mean_size, x='Week', y='Size', hue='Arm',
                  style='Arm', markers=['o', 's'], markersize=6,
                  palette={'Vehicle': '#457b9d', 'Treatment': '#e63946'},
                  linewidth=1.8)
ax.set_xlabel('Week')
ax.set_ylabel('Tumor volume (mm$^3$)')
ax.legend(frameon=False, title=None)
ax.spines[['top', 'right']].set_visible(False)
plt.tight_layout()
plt.show()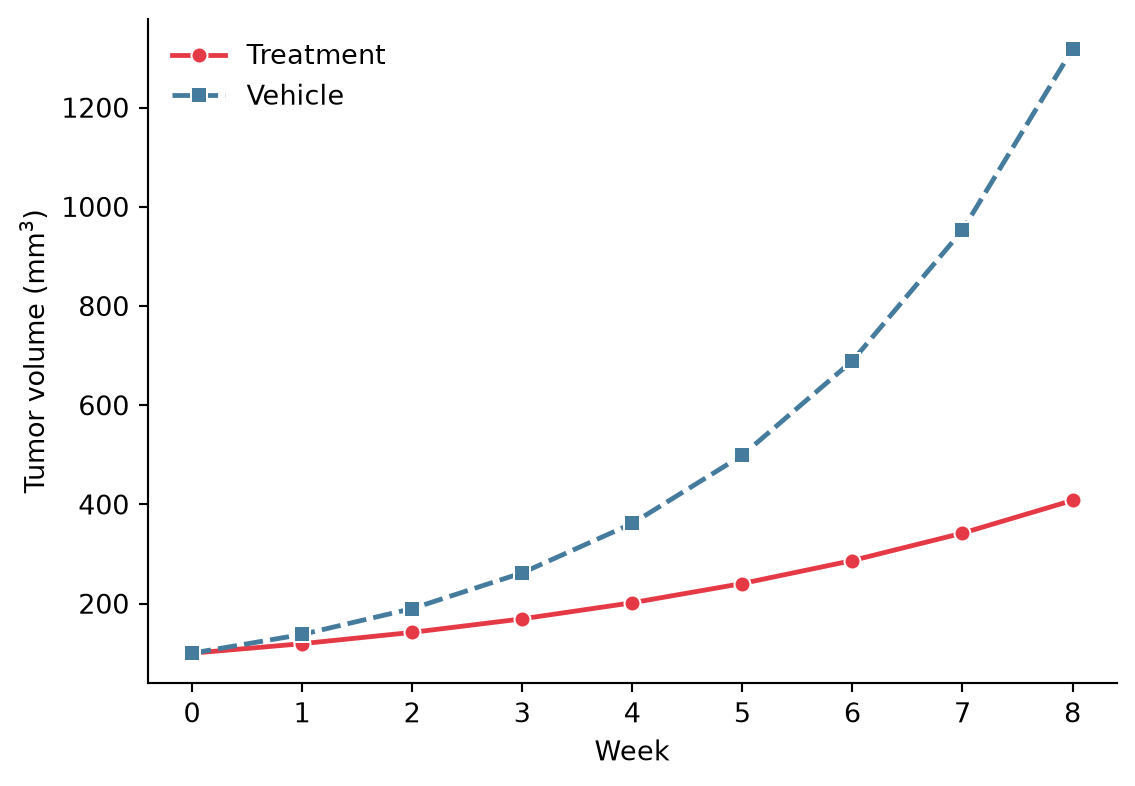
带置信带的折线图
将原始重复测量传入 seaborn.lineplot 并设置 errorbar=('ci', 95),即可对每组均值进行自助法 95% 置信带估计——临床前研究图形的默认不确定性展示。
plt.figure(figsize=(6, 4.2))
ax = sns.lineplot(data=tumor, x='Week', y='Size', hue='Arm',
                  errorbar=('ci', 95), err_kws=dict(alpha=0.2),
                  palette={'Vehicle': '#457b9d', 'Treatment': '#e63946'},
                  linewidth=1.8)
ax.set_xlabel('Week')
ax.set_ylabel('Tumor volume (mm$^3$)')
ax.legend(frameon=False, title=None)
ax.spines[['top', 'right']].set_visible(False)
plt.tight_layout()
plt.show()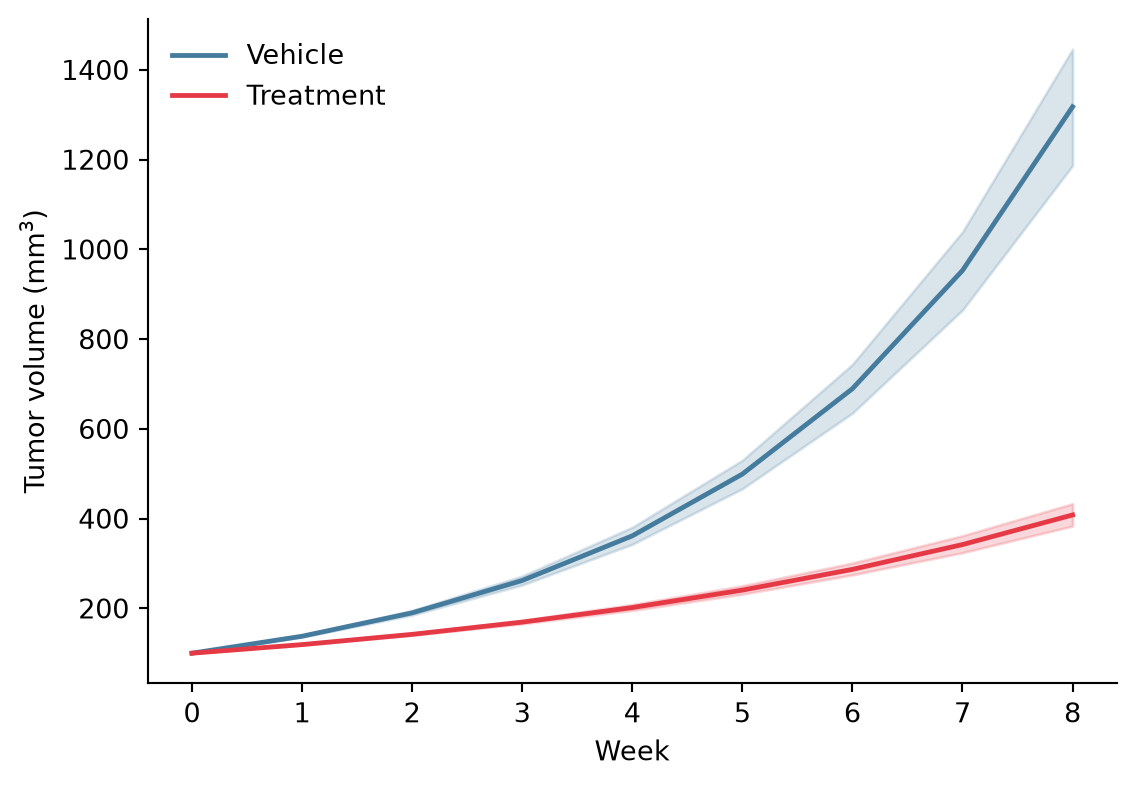
意大利面条图叠加群体均值
将每个受试对象画为细线并置于加粗组均值之后,同时传达趋势与个体间变异——许多期刊比单纯置信带更青睐这种形式。
fig, ax = plt.subplots(figsize=(6, 4.2))
sns.lineplot(data=tumor, x='Week', y='Size', hue='Arm', units='Mouse',
             estimator=None, alpha=0.25, linewidth=0.9, legend=False,
             palette={'Vehicle': '#457b9d', 'Treatment': '#e63946'}, ax=ax)
mean_size = tumor.groupby(['Arm', 'Week'], as_index=False)['Size'].mean()
sns.lineplot(data=mean_size, x='Week', y='Size', hue='Arm',
             palette={'Vehicle': '#457b9d', 'Treatment': '#e63946'},
             linewidth=2.4, ax=ax)
ax.set_xlabel('Week')
ax.set_ylabel('Tumor volume (mm$^3$)')
ax.legend(frameon=False, title=None)
ax.spines[['top', 'right']].set_visible(False)
plt.tight_layout()
plt.show()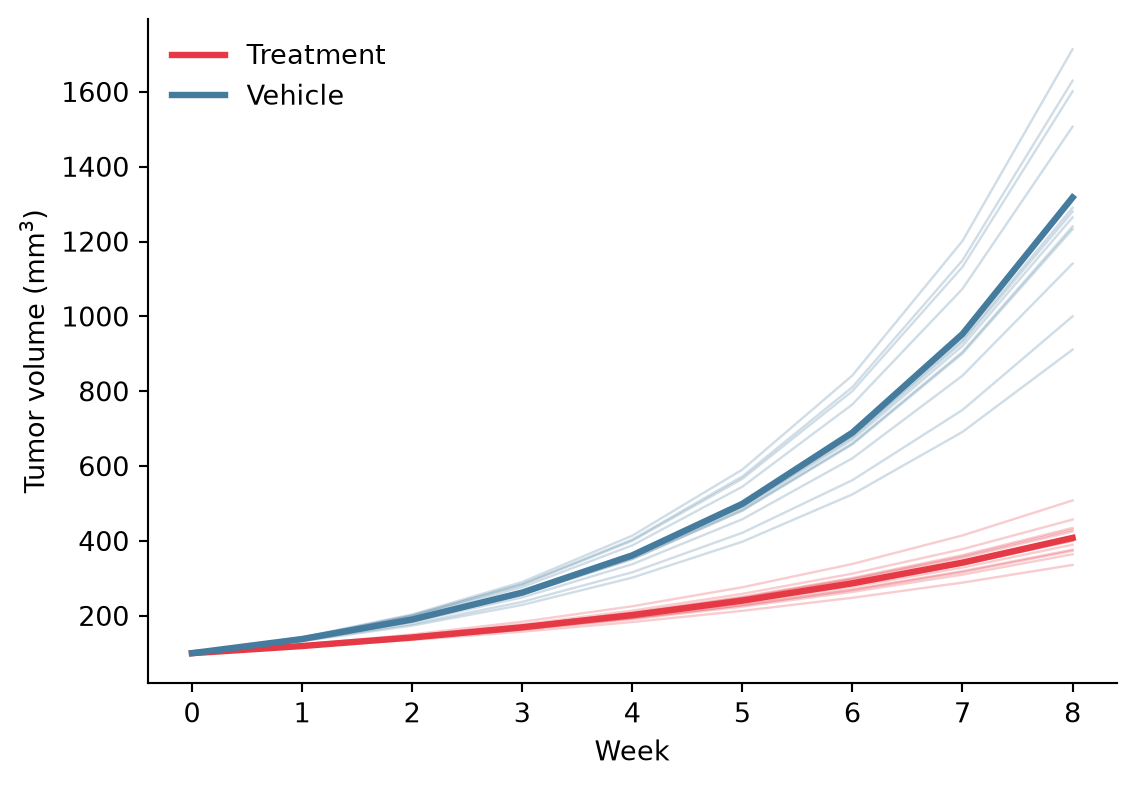
参考文献
- Hunter, J. D. (2007). Matplotlib: A 2D graphics environment. Computing in Science & Engineering, 9(3), 90-95.
- Waskom, M. L. (2021). seaborn: statistical data visualization. Journal of Open Source Software, 6(60), 3021.