import matplotlib.pyplot as plt
import pandas as pd
import numpy as npUpSet 图(Python)
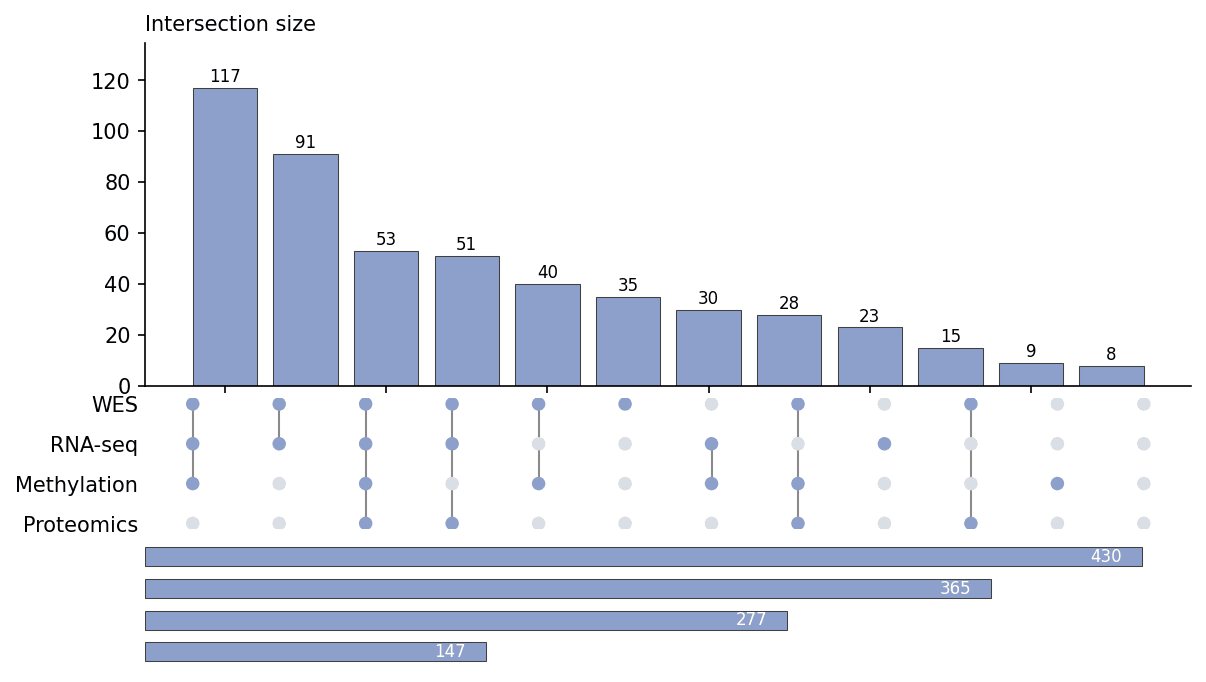
UpSet 图以「点阵矩阵 + 柱状图」的组合展示多个集合的交集:上方柱高为交集大小,下方点阵标明参与交集的集合,轻松扩展到 Venn 图无法胜任的多于三个集合的场景。在生物医学研究中,它是跨队列、跨平台、跨亚型的突变或基因列表交集的标准视图。matplotlib 用三个垂直对齐的面板——交集柱、成员矩阵、集合总量条——即可构建,无需额外依赖。
示例
环境配置
- 系统要求:跨平台(Linux/MacOS/Windows)
- 编程语言:Python
- 依赖包:
matplotlib、pandas、numpy
数据准备
我们汇总 500 基因 panel 中每个基因被四种组学平台(WES、RNA-seq、甲基化芯片、蛋白质组学)覆盖的情况,再聚合为交集大小——每个成员模式一行。
np.random.seed(81)

platforms = ['WES', 'RNA-seq', 'Methylation', 'Proteomics']
p_present = [0.85, 0.70, 0.55, 0.35]
n_genes = 500

membership = pd.DataFrame(
    np.random.random((n_genes, 4)) < p_present, columns=platforms)
membership['Proteomics'] &= membership['WES']   # 配对平台略有相关

intersections = membership.groupby(platforms, observed=True).size()
intersections = intersections.sort_values(ascending=False)
set_sizes = membership.sum()
可视化
手写 UpSet 图
三个垂直对齐的面板共享交集 x 轴:柱为交集大小,点阵为成员关系,横条为各集合总量。
n_int = len(intersections)
xs = np.arange(n_int)

fig, (ax_size, ax_mat, ax_sets) = plt.subplots(
    3, 1, figsize=(9, 5.4), sharex=False,
    gridspec_kw={'height_ratios': [3, 1.15, 1.1], 'hspace': 0.06})

ax_size.bar(xs, intersections.values, color='#8da0cb',
            edgecolor='0.25', linewidth=0.5)
for x, v in zip(xs, intersections.values):
    ax_size.text(x, v + max(intersections) * 0.02, str(v),
                 ha='center', fontsize=8)
ax_size.set_ylim(0, max(intersections) * 1.15)
ax_size.set_title('Intersection size', loc='left', fontsize=10)
ax_size.spines[['top', 'right']].set_visible(False)

for x, (pattern, size) in enumerate(intersections.items()):
    rows = [i for i, on in enumerate(pattern) if on]
    if rows:
        ax_mat.plot([x, x], [min(rows), max(rows)], color='0.55', linewidth=1)
    for i, on in enumerate(pattern):
        ax_mat.scatter(x, i, s=42,
                       color='#8da0cb' if on else '#d9dee6',
                       edgecolor='none', zorder=3)
ax_mat.set_yticks(range(len(platforms)), platforms)
ax_mat.invert_yaxis()
ax_mat.set_xticks([])
ax_mat.spines[['top', 'right', 'left', 'bottom']].set_visible(False)
ax_mat.tick_params(length=0)

ax_sets.barh(range(len(platforms)), set_sizes[platforms].values,
             color='#8da0cb', edgecolor='0.25', linewidth=0.5, height=0.6)
ax_sets.invert_yaxis()
ax_sets.set_xticks([]); ax_sets.set_yticks([])
ax_sets.spines[['top', 'right', 'left', 'bottom']].set_visible(False)
ax_sets.tick_params(length=0)
for i, v in enumerate(set_sizes[platforms].values):
    ax_sets.text(v - max(set_sizes) * 0.02, i, str(v), va='center',
                 ha='right', fontsize=8, color='white')

plt.show()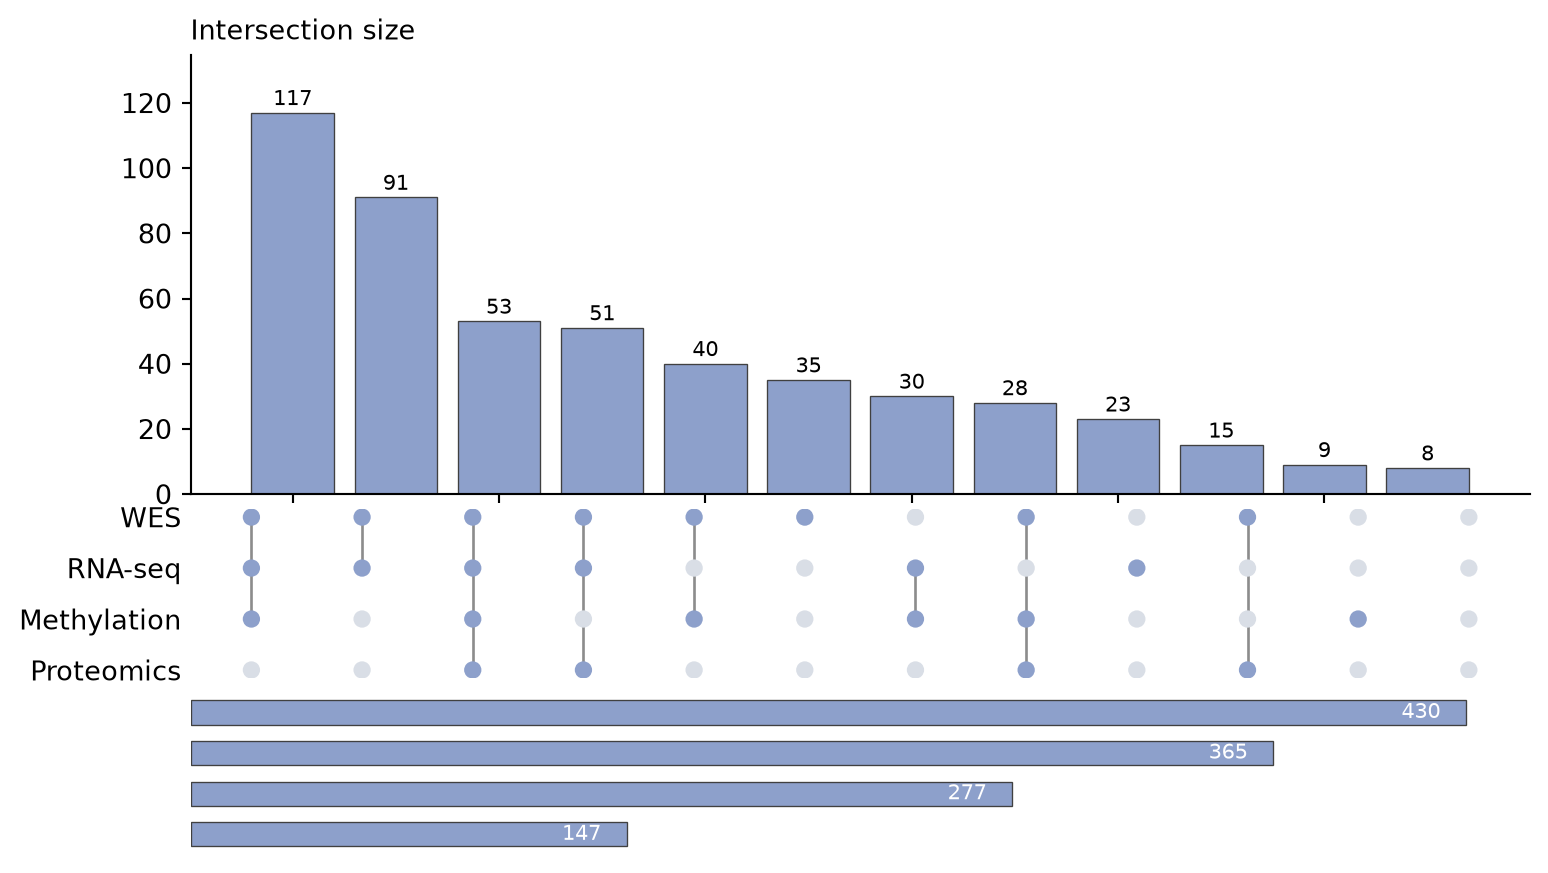
按覆盖度排序
按覆盖平台数预排序交集,把图形变成一份数据完整性陈述;全平台覆盖的交集以红色突出。
degree = np.asarray(intersections.index.to_frame(index=False).sum(axis=1))
order = np.argsort(-degree, kind='stable')
by_degree = intersections.iloc[order]

n_int = len(by_degree)
xs = np.arange(n_int)

fig, (ax_size, ax_mat) = plt.subplots(
    2, 1, figsize=(9, 4.6), sharex=False,
    gridspec_kw={'height_ratios': [3, 1.15], 'hspace': 0.07})

full_coverage = degree[order] == len(platforms)
ax_size.bar(xs, by_degree.values,
            color=['#e63946' if f else '#8da0cb' for f in full_coverage],
            edgecolor='0.25', linewidth=0.5)
for x, v in zip(xs, by_degree.values):
    ax_size.text(x, v + max(by_degree) * 0.02, str(v), ha='center', fontsize=8)
ax_size.set_ylim(0, max(by_degree) * 1.15)
ax_size.set_title('Intersection size (red = all four platforms)',
                  loc='left', fontsize=10)
ax_size.spines[['top', 'right']].set_visible(False)

for x, (pattern, size) in enumerate(by_degree.items()):
    rows = [i for i, on in enumerate(pattern) if on]
    if rows:
        ax_mat.plot([x, x], [min(rows), max(rows)], color='0.55', linewidth=1)
    for i, on in enumerate(pattern):
        ax_mat.scatter(x, i, s=42,
                       color='#8da0cb' if on else '#d9dee6',
                       edgecolor='none', zorder=3)
ax_mat.set_yticks(range(len(platforms)), platforms)
ax_mat.invert_yaxis()
ax_mat.set_xticks([])
ax_mat.spines[['top', 'right', 'left', 'bottom']].set_visible(False)
ax_mat.tick_params(length=0)

plt.show()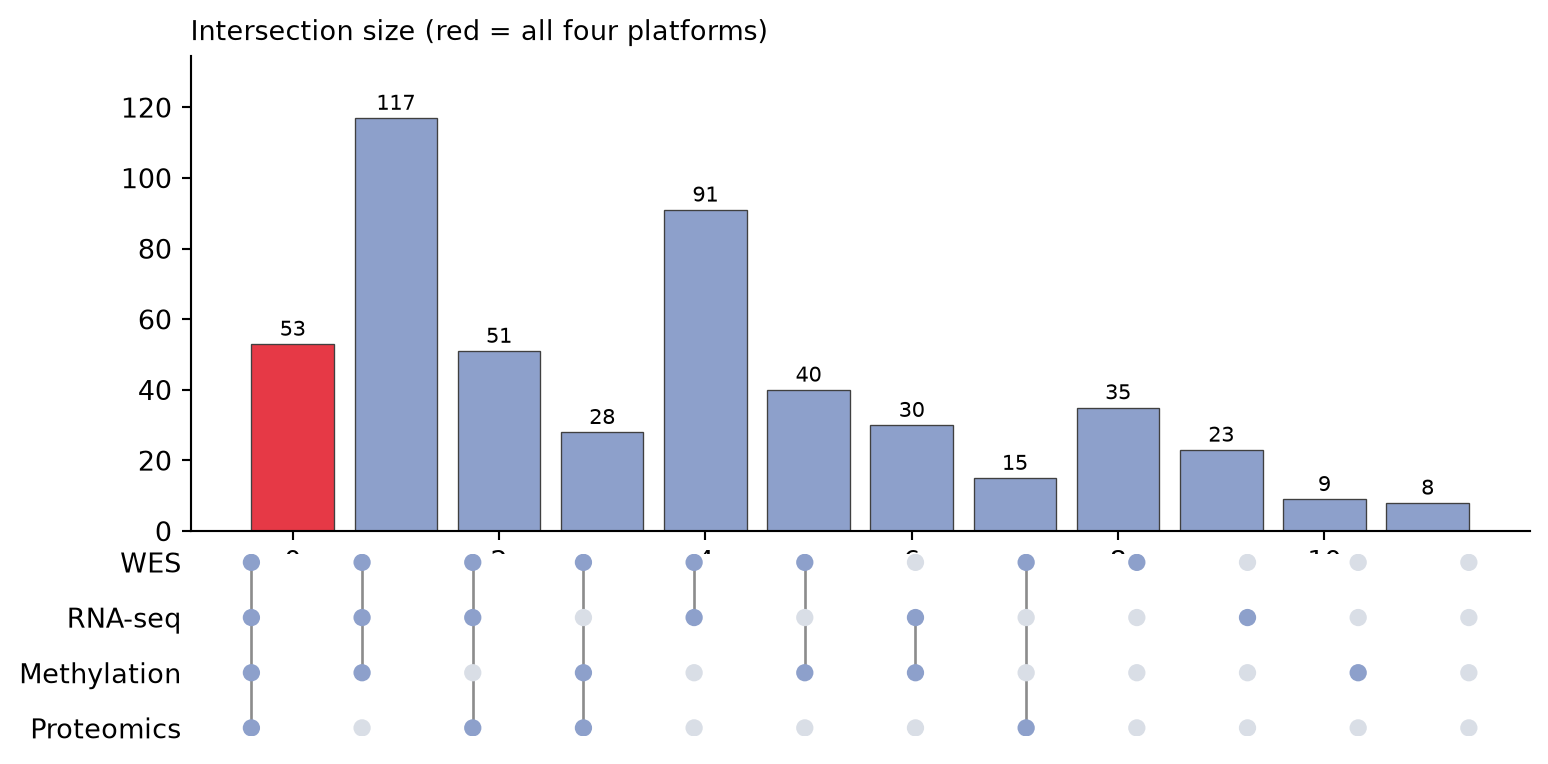
参考文献
- Lex, A., Gehlenborg, N., Strobelt, H., Vuillemot, R., & Pfister, H. (2014). UpSet: Visualization of Intersecting Sets. IEEE Transactions on Visualization and Computer Graphics, 20(12), 1983-1992.
- Hunter, J. D. (2007). Matplotlib: A 2D graphics environment. Computing in Science & Engineering, 9(3), 90-95.