# 安装必要的包(Bioconductor)
if (!requireNamespace("BiocManager", quietly = TRUE)) {
  install.packages("BiocManager")
}
if (!requireNamespace("clusterProfiler", quietly = TRUE)) {
  BiocManager::install("clusterProfiler")
}
if (!requireNamespace("patchwork", quietly = TRUE)) {
  install.packages("patchwork")
}

# 加载包
library(clusterProfiler)
library(enrichplot)
library(ggplot2)
library(dplyr)
library(patchwork)GSEA 运行得分图
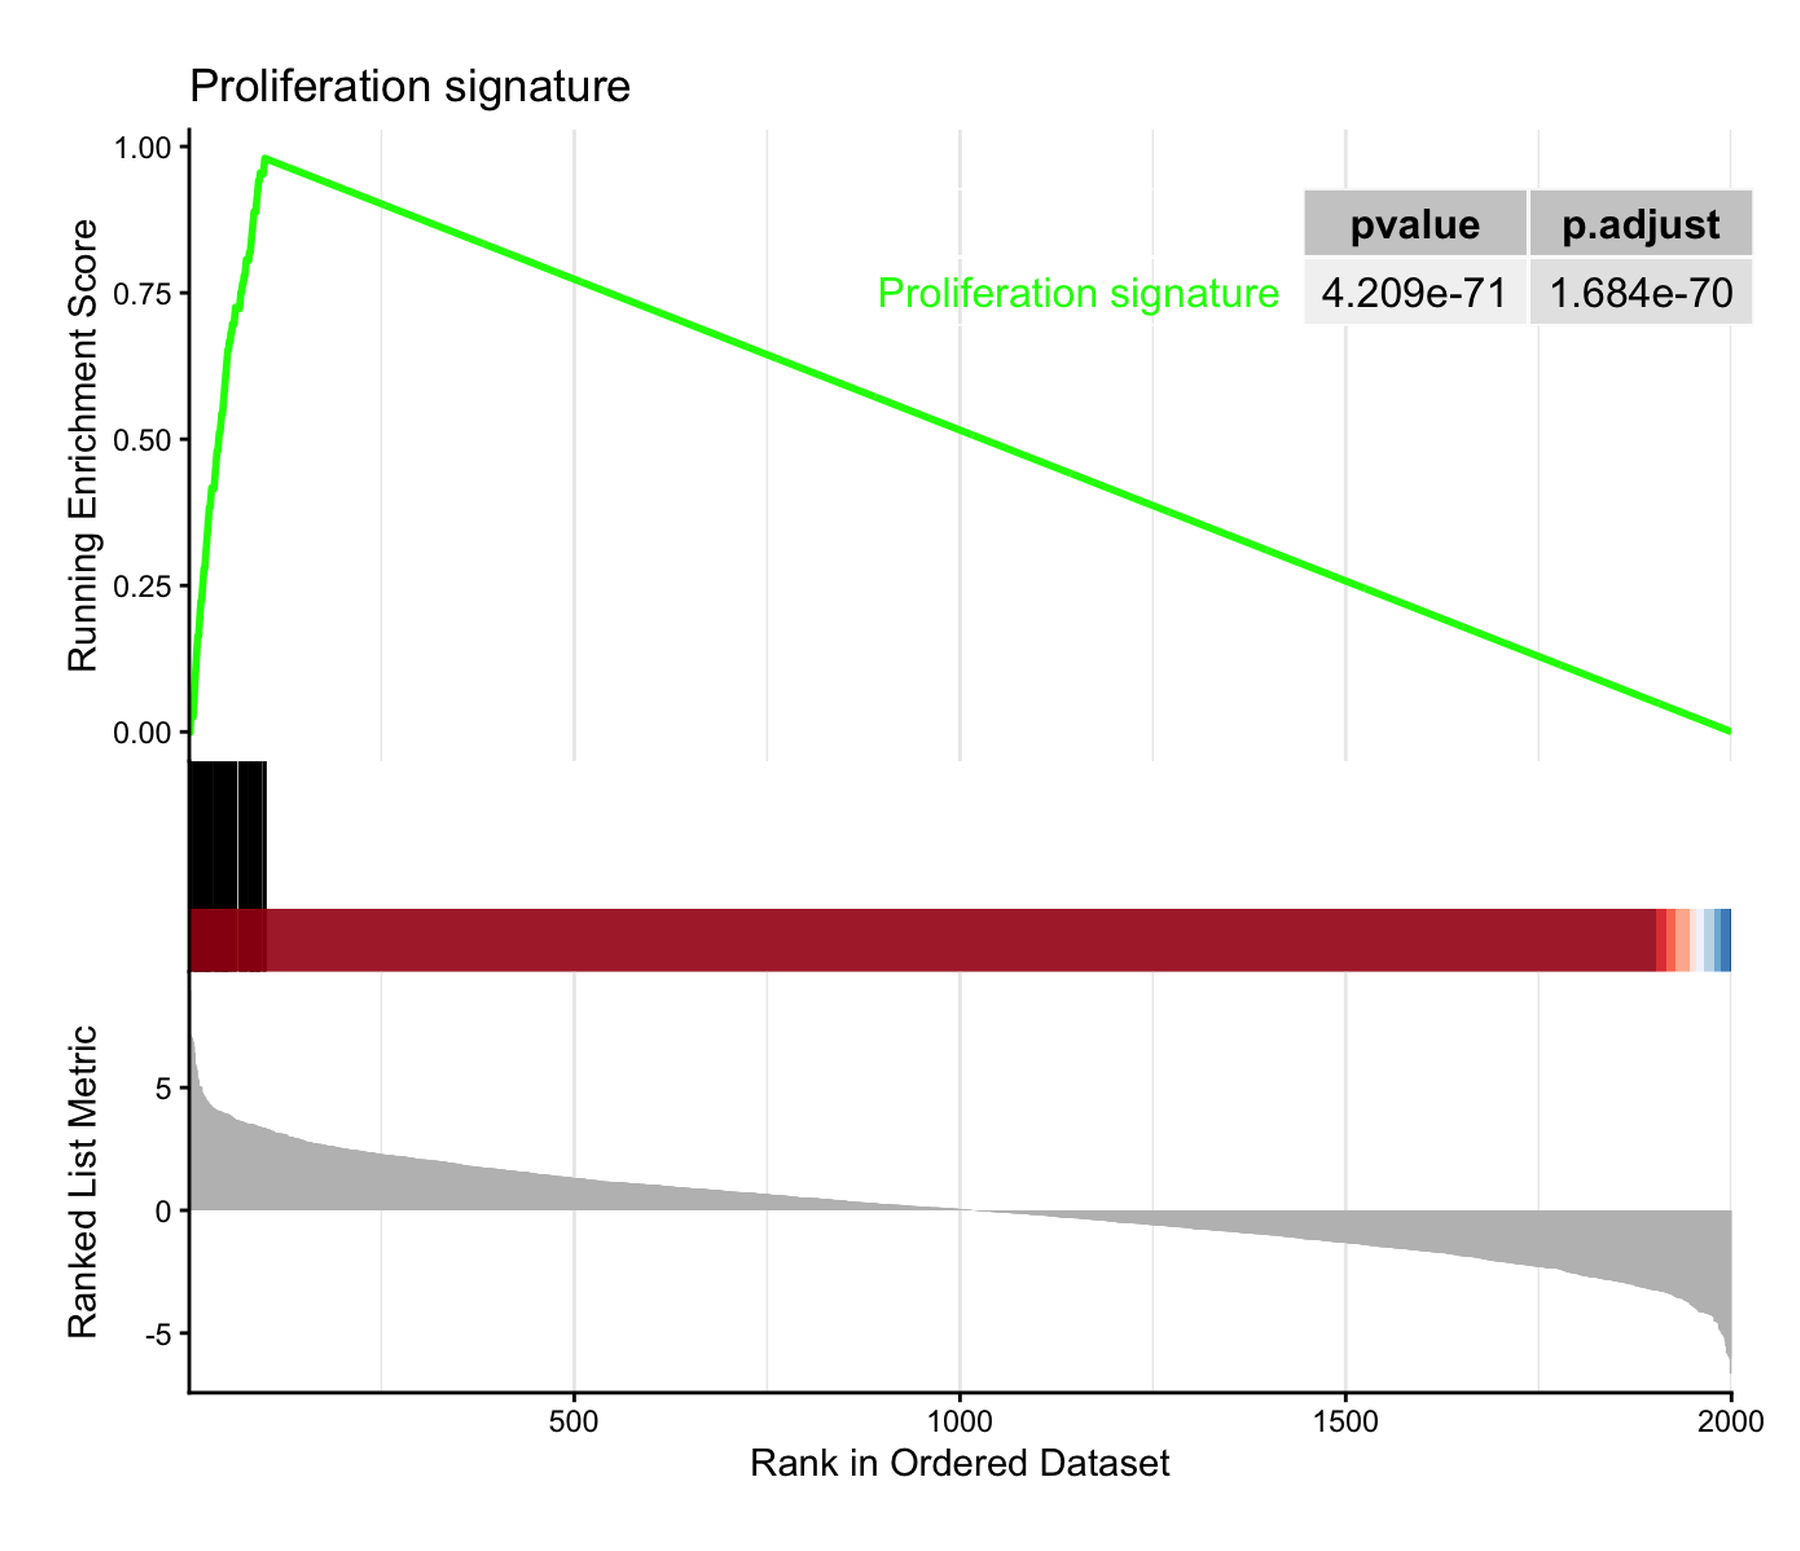
基因集富集分析(GSEA)检验一个已定义的基因集(通路、特征基因)是否在全基因组排序表中聚集在一端 [1]。它的经典配图是运行得分图:排序统计量以条形码形式展示(顶部),行走的富集得分在基因集成员命中处上升、在未命中处下降,峰值即富集得分(中部),基因集成员位置以毯子图(rug)标出(底部)。与过表达分析不同,GSEA 使用完整排序表——不需要对输入基因人为设定显著性截断——这正是”图”而非”表”承载论证的原因。
在 R 中分析由 clusterProfiler::GSEA() [2] 完成,经典图形由 enrichplot::gseaplot2() [3] 绘制。本教程绘制经典图形、在同一排序表上叠加多个基因集,并用 ggplot2 从基本组件重建运行得分,使统计量本身变得可读。本教程的 Python 对应版本见 GSEA 运行得分图(Python)。
本教程涵盖三种工作流:
- 经典
gseaplot2运行得分图(带 p 值表); - 多个基因集叠加在同一排序表上;
- 手绘三面板运行 ES 重建(ggplot2 + patchwork)。
Example
Setup
系统要求:跨平台(Linux/MacOS/Windows)
编程语言:R
依赖包:
clusterProfiler;enrichplot;ggplot2;dplyr;patchwork
sessioninfo::session_info("attached")─ Session info ───────────────────────────────────────────────────────────────
setting value
version R version 4.6.2 (2026-10-29)
os Ubuntu 24.04.5 LTS
system x86_64, linux-gnu
ui X11
language (EN)
collate C.UTF-8
ctype C.UTF-8
tz UTC
date 2026-10-30
pandoc 3.1.3 @ /usr/bin/ (via rmarkdown)
quarto 1.10.19 @ /usr/local/bin/quarto
─ Packages ───────────────────────────────────────────────────────────────────
! package * version date (UTC) lib source
P clusterProfiler * 4.20.3 2026-10-19 [?] Bioconductor 3.23 (R 4.6.2)
P dplyr * 1.2.1 2026-04-03 [?] RSPM
P enrichplot * 1.32.1 2026-09-28 [?] Bioconductor 3.23 (R 4.6.2)
P ggplot2 * 4.0.3.9000 2026-10-30 [?] Github (tidyverse/ggplot2@b638d65)
P patchwork * 1.3.2 2025-08-25 [?] RSPM
[1] /home/runner/.cache/R/renv/library/Bizard-5140bdc6/linux-ubuntu-noble/R-4.6/x86_64-pc-linux-gnu
[2] /home/runner/work/_temp/Library
[3] /opt/R/4.6.2/lib/R/library
* ── Packages attached to the search path.
P ── Loaded and on-disk path mismatch.
──────────────────────────────────────────────────────────────────────────────Data Preparation
为保证教程完全可复现,我们模拟排序表与基因集而非下载 MSigDB:2,000 个基因按 Wald 式统计量排序;一个集中在排序顶部的 60 基因”增殖”集、一个位于底部的 50 基因”代谢”集,以及两个中性集——这一配置能产生干净可读的富集得分。clusterProfiler::GSEA() 需要”命名且降序排序”的数值向量(geneList)和 TERM2GENE 数据框。
set.seed(251)

n_genes <- 2000
genes <- paste0("Gene", sprintf("%04d", 1:n_genes))
stats <- rnorm(n_genes, sd = 2)
names(stats) <- genes

geneList <- sort(stats, decreasing = TRUE)   # 必须降序排序

# 模拟基因集:一个在顶部、一个在底部、两个中性
gs_up   <- sample(genes[order(stats, decreasing = TRUE)[1:100]], 60)
gs_down <- sample(genes[order(stats)[1:100]], 50)
gs_neu1 <- sample(genes, 80)
gs_neu2 <- sample(genes, 70)

term2gene <- dplyr::bind_rows(
  data.frame(term = "Proliferation signature",     gene = gs_up),
  data.frame(term = "Metabolic repression",        gene = gs_down),
  data.frame(term = "Hypoxia response",            gene = gs_neu1),
  data.frame(term = "Immune checkpoint pathway",   gene = gs_neu2)
)

set.seed(251)  # GSEA 对基因集做置换抽样;保持 p 值可复现
gser <- GSEA(geneList, TERM2GENE = term2gene,
             minGSSize = 40, maxGSSize = 500,
             pvalueCutoff = 1,      # 教学目的保留全部基因集
             eps = 0, seed = TRUE, verbose = FALSE)

as.data.frame(gser) |>
  dplyr::select(ID, setSize, enrichmentScore, NES, pvalue, p.adjust)
ID setSize enrichmentScore
Proliferation signature Proliferation signature 60 0.9798969
Metabolic repression Metabolic repression 50 -0.9743590
Hypoxia response Hypoxia response 80 0.2660821
Immune checkpoint pathway Immune checkpoint pathway 70 -0.2202139
NES pvalue p.adjust
Proliferation signature 3.951487 6.001589e-73 2.400636e-72
Metabolic repression -3.780863 4.617454e-58 9.234909e-58
Hypoxia response 1.136434 2.030361e-01 2.707147e-01
Immune checkpoint pathway -0.925151 6.088710e-01 6.088710e-01Metabolic repression 的负 NES 表示该基因集聚集在排序表底部(下调基因);中性集的 NES 在 0 附近徘徊。
Visualization
1. 经典运行得分图
gseaplot2(gser, geneSetID = 1, pvalue_table = TRUE,
          title = "Proliferation signature")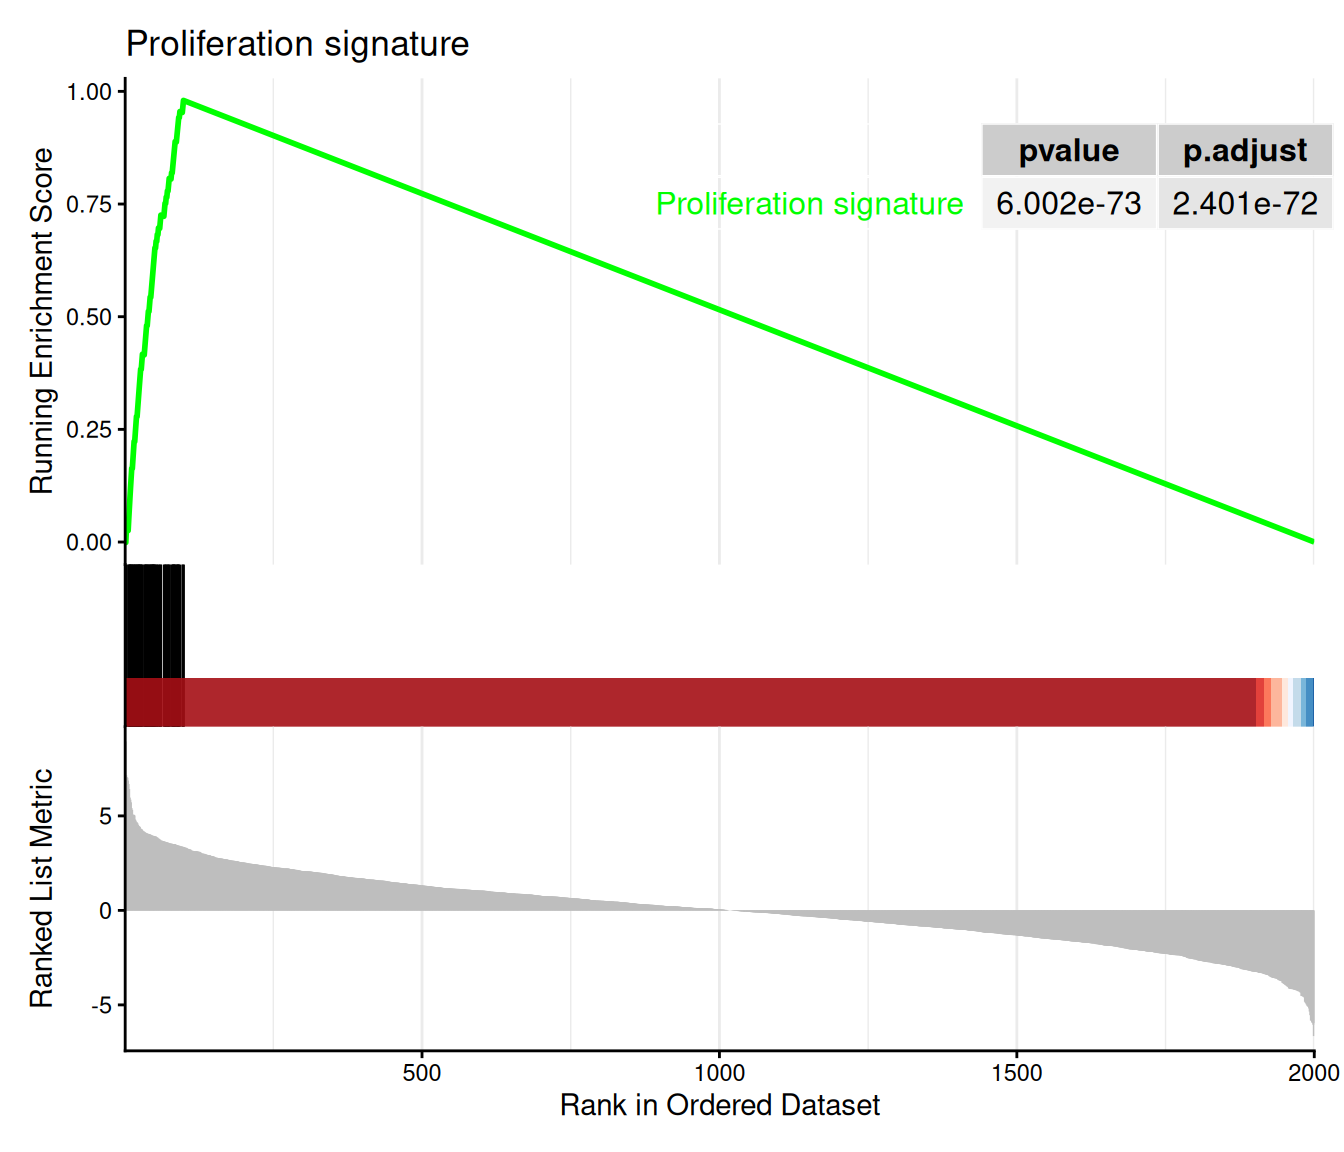
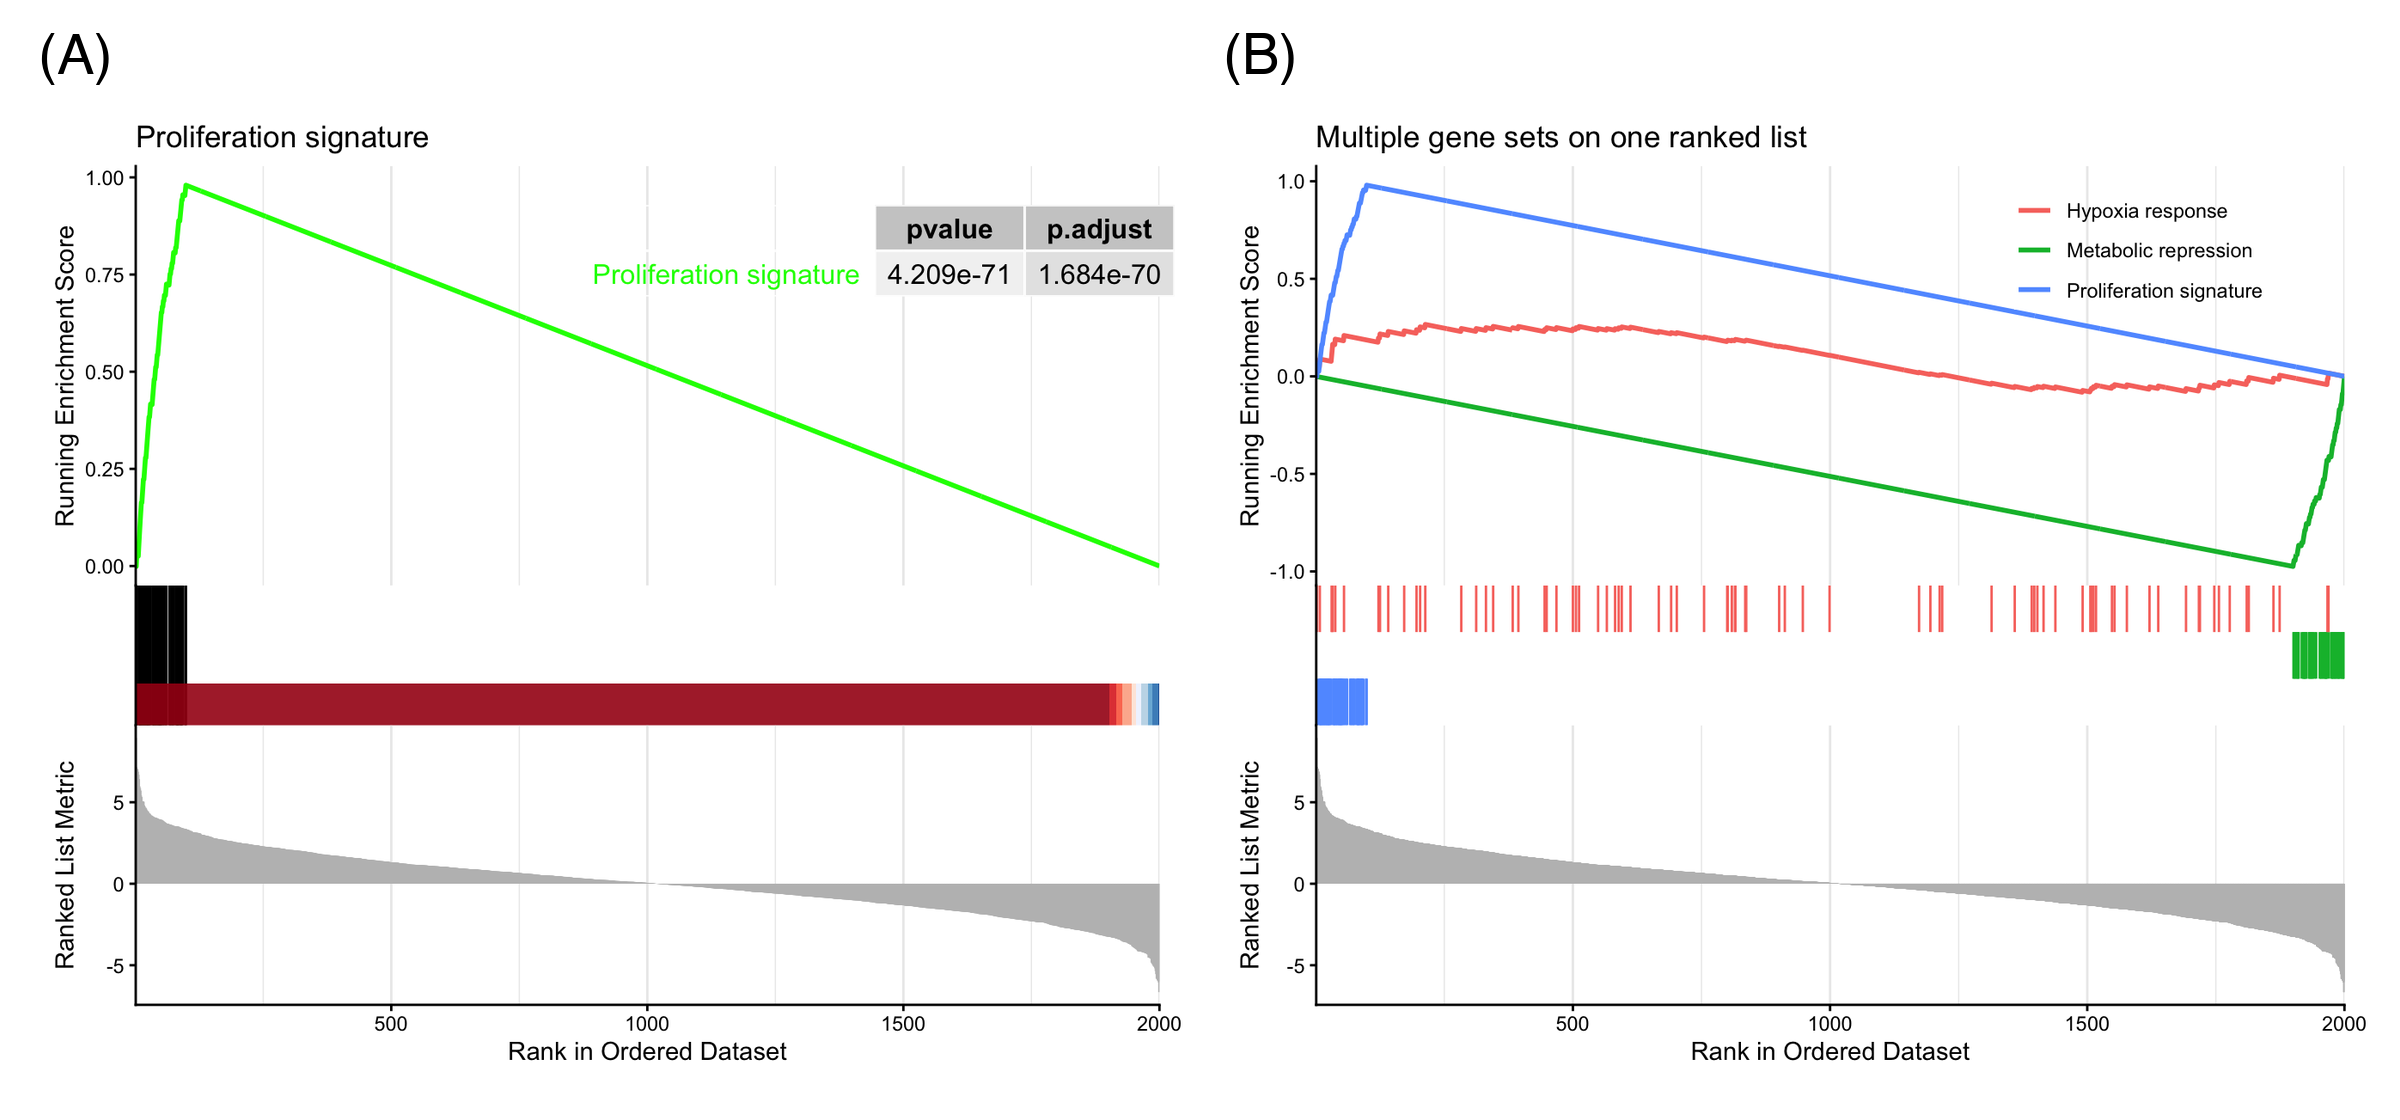
三个面板共享同一横轴(排名位置):运行 ES 在前 100 名(基因集成员所在)陡峭爬升、在富集得分处达峰后衰减;毯子图标出成员位置;底部曲线即排序统计量本身。峰值位置定义leading edge——驱动富集的基因。
2. 同一排序表上的多个基因集
ids <- match(c("Proliferation signature", "Metabolic repression", "Hypoxia response"),
             gser$ID)
gseaplot2(gser, geneSetID = ids, pvalue_table = FALSE,
          title = "Multiple gene sets on one ranked list")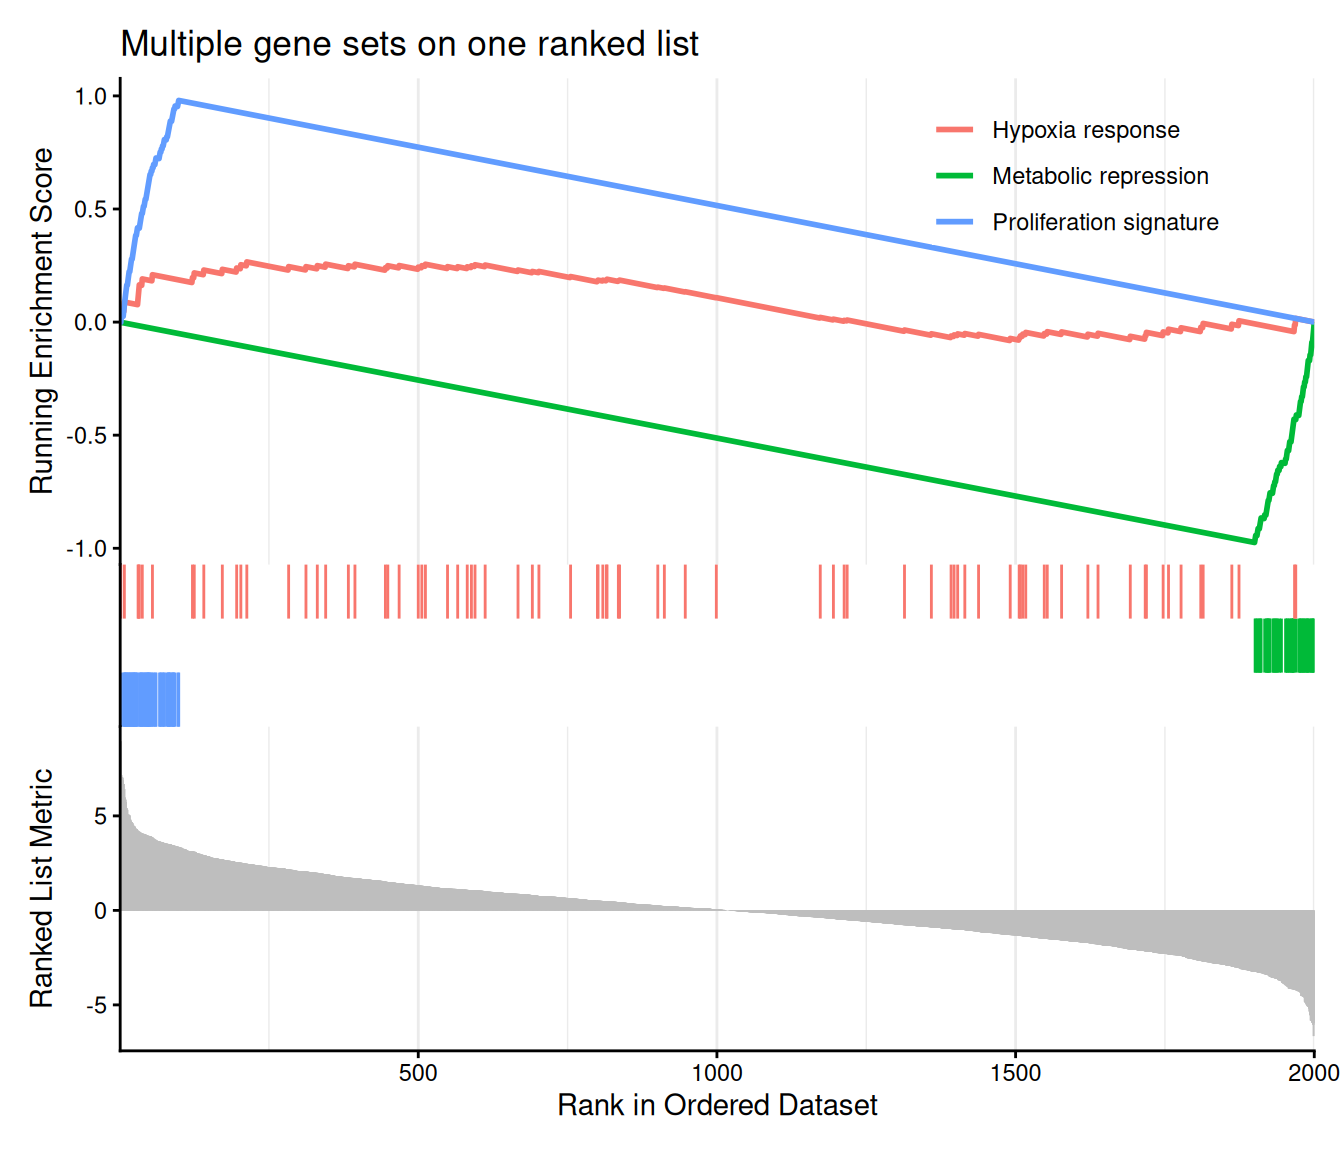
叠加基因集是比较 GSEA 结果的日常方式:上调富集的集早早达峰并缓慢衰减,下调富集的集在排序表末端俯冲至负的最小值,零假设下的集在 0 附近徘徊。图例标签跟随所选基因集;color 参数控制调色板。
3. 从基本组件重建运行得分
in_set  <- names(geneList) %in% gs_up
w       <- abs(geneList)
step    <- ifelse(in_set, w / sum(w[in_set]), -1 / sum(!in_set))
run_es  <- cumsum(step)
peak    <- which.max(run_es)

df <- data.frame(rank = seq_along(geneList),
                 stat = as.numeric(geneList),
                 es = run_es, hit = in_set)

p_top <- ggplot(df, aes(rank, stat)) +
  geom_segment(aes(xend = rank, yend = 0, color = hit),
               linewidth = 0.15, show.legend = FALSE) +
  scale_color_manual(values = c(`FALSE` = "grey70", `TRUE` = "#e63946")) +
  geom_vline(xintercept = peak, linetype = "dashed",
             color = "#1d3557", alpha = 0.5) +
  labs(y = "Ranked statistic", x = NULL) +
  theme_classic()

p_mid <- ggplot(df, aes(rank, es)) +
  geom_line(color = "#1d3557", linewidth = 0.8) +
  geom_point(data = df[peak, ], color = "#e63946", size = 2) +
  annotate("text", x = peak, y = max(run_es), vjust = -0.8, hjust = 0,
           label = sprintf("ES = %.2f at rank %d", max(run_es), peak), size = 3.5) +
  labs(y = "Running ES", x = NULL) +
  theme_classic()

p_rug <- ggplot(df[df$hit, ], aes(x = rank, y = 1)) +
  geom_segment(aes(xend = rank, yend = 0.55),
               linewidth = 0.3, color = "#e63946") +
  scale_y_continuous(limits = c(0, 1), expand = c(0, 0)) +
  theme_void()

p3 <- p_top / p_mid / p_rug +
  plot_layout(heights = c(3, 2, 0.5))
p3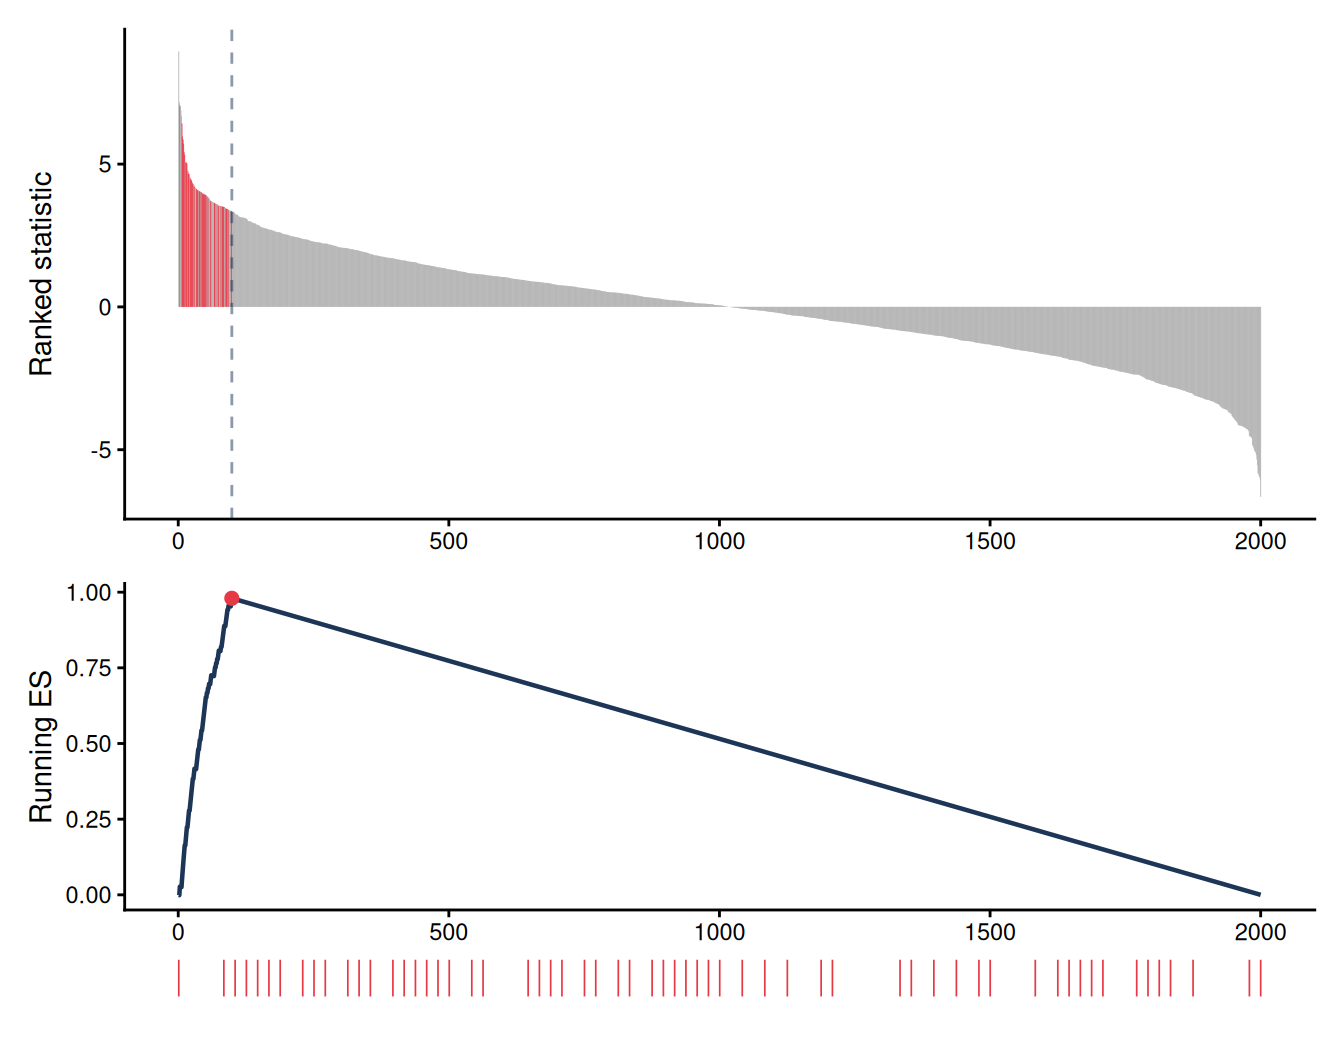
加权运行 ES 是一个累计和:在基因集成员处加上其 |统计量| 除以成员总权重,在未命中处减去 1/(N − n)。从基本组件重建它揭开了 gseaplot2 的面纱——第 1 节的曲线正是这条行走轨迹——也让自定义变体(leading edge 注释、分面板主题、多图版式)变得直观。
提示实践要点
-
geneList必须是命名且降序排序的数值向量,否则GSEA()报错 “geneList should be a decreasing sorted vector”。 - 探索阶段用
pvalueCutoff = 1,避免被过滤的基因集从结果对象中悄悄消失。 - 传入
seed = TRUE(配合set.seed())保证置换 p 值可复现。 - 报告 NES 配合 p.adjust,而非原始 ES:ES 依赖基因集大小,NES 已对其标准化。
Application
运行得分 GSEA 图是转录组差异通路水平解读的标准配图:肿瘤-正常特征、药物扰动筛选和单细胞聚类标志基因。下图模拟典型论文版式:(A) 带p值表的经典单集图,(B) 多集叠加图。
Reference
[1] Subramanian A, Tamayo P, Mootha VK, et al. Gene set enrichment analysis: a knowledge-based approach for interpreting genome-wide expression profiles. Proc Natl Acad Sci USA. 2005;102(43):15545-15550. doi:10.1073/pnas.0506580102
[2] Wu T, Hu E, Xu S, et al. clusterProfiler 4.0: a universal enrichment tool for interpreting omics data. Innovation. 2021;2(3):100141. doi:10.1016/j.xinn.2021.100141
[3] Yu G. enrichplot: visualization of functional enrichment result. Bioconductor package. https://bioconductor.org/packages/enrichplot/