import matplotlib.pyplot as plt
from pywaffle import Waffle华夫饼图 (Python)
华夫饼图的 Python 对应版本——华夫饼图用单位方块网格取代以面积编码的饼图/环形图,一个方块代表一名患者(或 1% 的队列),比例靠数数而非估计角度获得。在临床报告中,它是队列构成、RECIST 反应类别、入组/知情同意分布等数据的饼图诚实替代:人类读者对计数和长度的判断远比对角度准确 [1]。
pywaffle 在 matplotlib 之上提供了 Waffle 图形类 [2];同样的网格也完全可以手工绘制。两个关键决定:方块比例(1 方块 = 1 名患者,或 1%)与计数不能整除网格时的取整规则——两者都要注明,否则方块会悄悄歪曲比例。
本教程涵盖两种工作流:
- 单队列 RECIST 反应的 10 x 10 华夫图;
- 共享类别配色的两治疗臂并排对比。
Example
Setup
- 系统要求:跨平台(Linux/MacOS/Windows)
- 编程语言:Python
- 依赖包:
matplotlib、pywaffle
Data Preparation
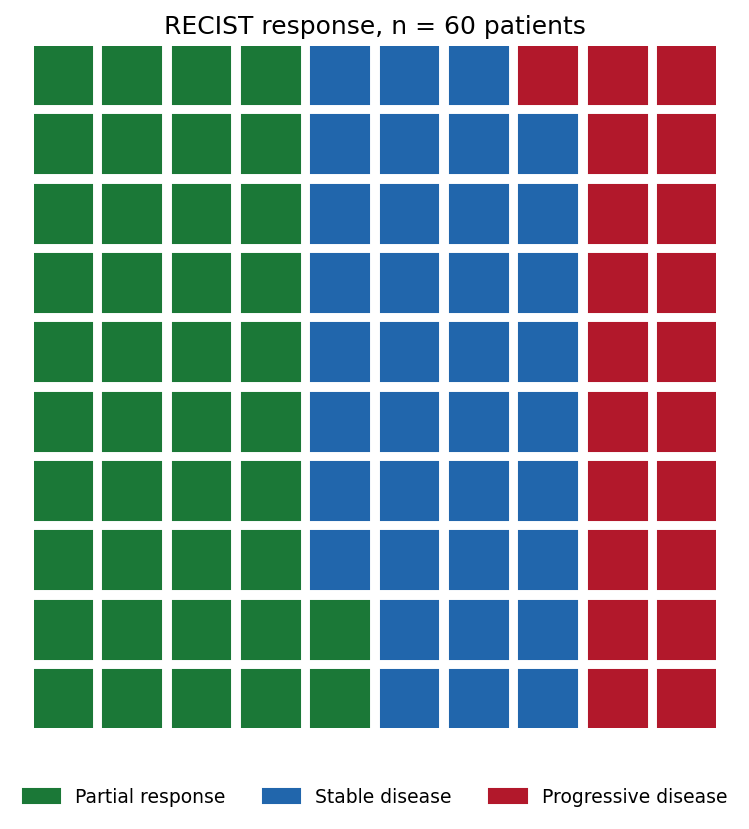
我们使用一个小型 II 期风格队列:60 名患者在第 12 周接受 RECIST 评估——25 例部分缓解、22 例疾病稳定、13 例疾病进展。另一个同规模对照臂(12/26/22)用于双面板对比。
treated = {"Partial response": 25, "Stable disease": 22,
           "Progressive disease": 13}
control = {"Partial response": 12, "Stable disease": 26,
           "Progressive disease": 22}
colors = {"Partial response": "#1B7837", "Stable disease": "#2166AC",
          "Progressive disease": "#B2182B"}
assert sum(treated.values()) == sum(control.values()) == 60
Visualization
1. 单队列华夫图
fig = plt.figure(figsize=(7, 5.6), FigureClass=Waffle,
                 rows=10, columns=10,
                 values=treated, colors=list(colors.values()),
                 block_aspect_ratio=1,
                 title={"label": "RECIST response, n = 60 patients",
                        "fontsize": 12},
                 legend={"loc": "lower center", "bbox_to_anchor": (0.5, -0.14),
                         "ncol": 3, "fontsize": 9, "frameon": False})
fig.tight_layout()
plt.show()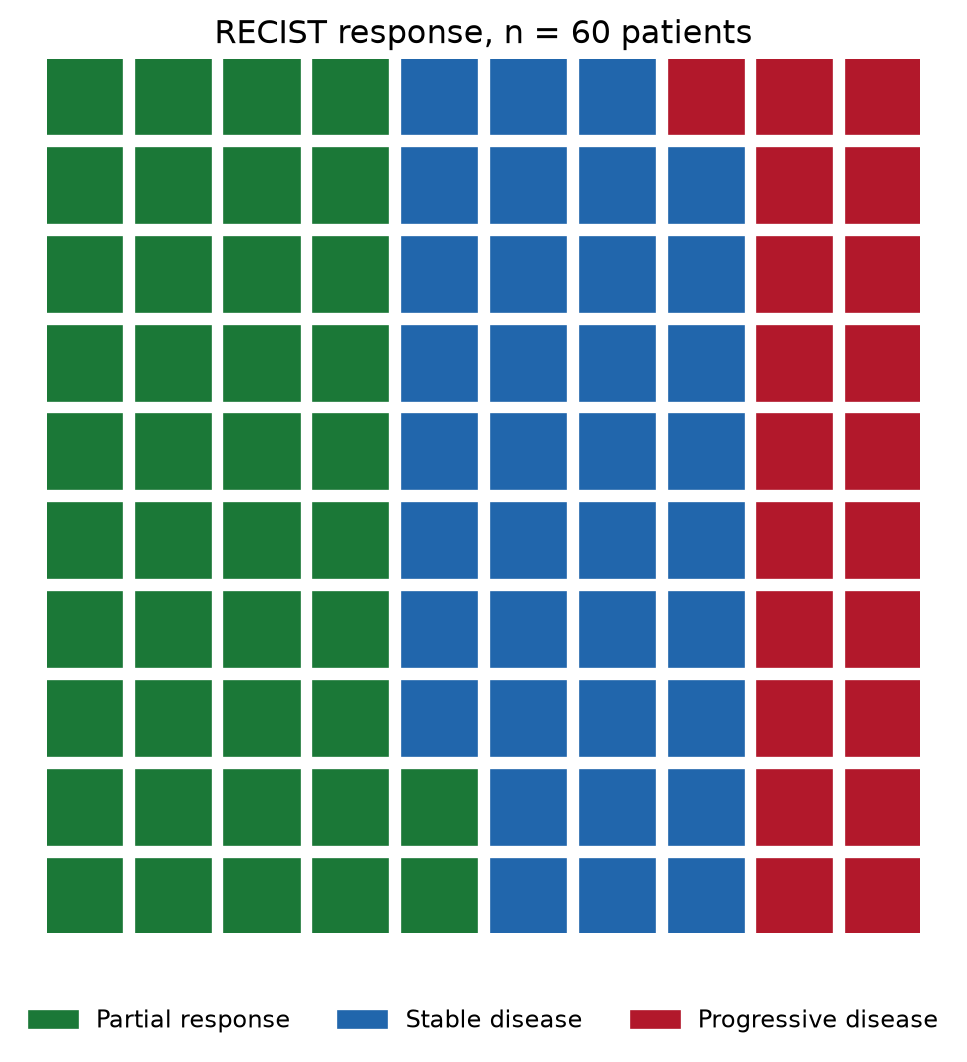
2. 两臂并排
legend_spec = {"loc": "lower center", "bbox_to_anchor": (0.5, -0.16),
               "ncol": 2, "fontsize": 8, "frameon": False}
fig = plt.figure(figsize=(11, 6.2), FigureClass=Waffle,
                 plots={
                     121: {"rows": 10, "columns": 6, "values": control,
                           "colors": list(colors.values()),
                           "title": {"label": "Control (n = 60)",
                                     "fontsize": 11},
                           "legend": legend_spec},
                     122: {"rows": 10, "columns": 6, "values": treated,
                           "colors": list(colors.values()),
                           "title": {"label": "Treatment (n = 60)",
                                     "fontsize": 11},
                           "legend": legend_spec},
                 })
fig.suptitle("One block = 1 patient", fontsize=12, y=0.99)
plt.show()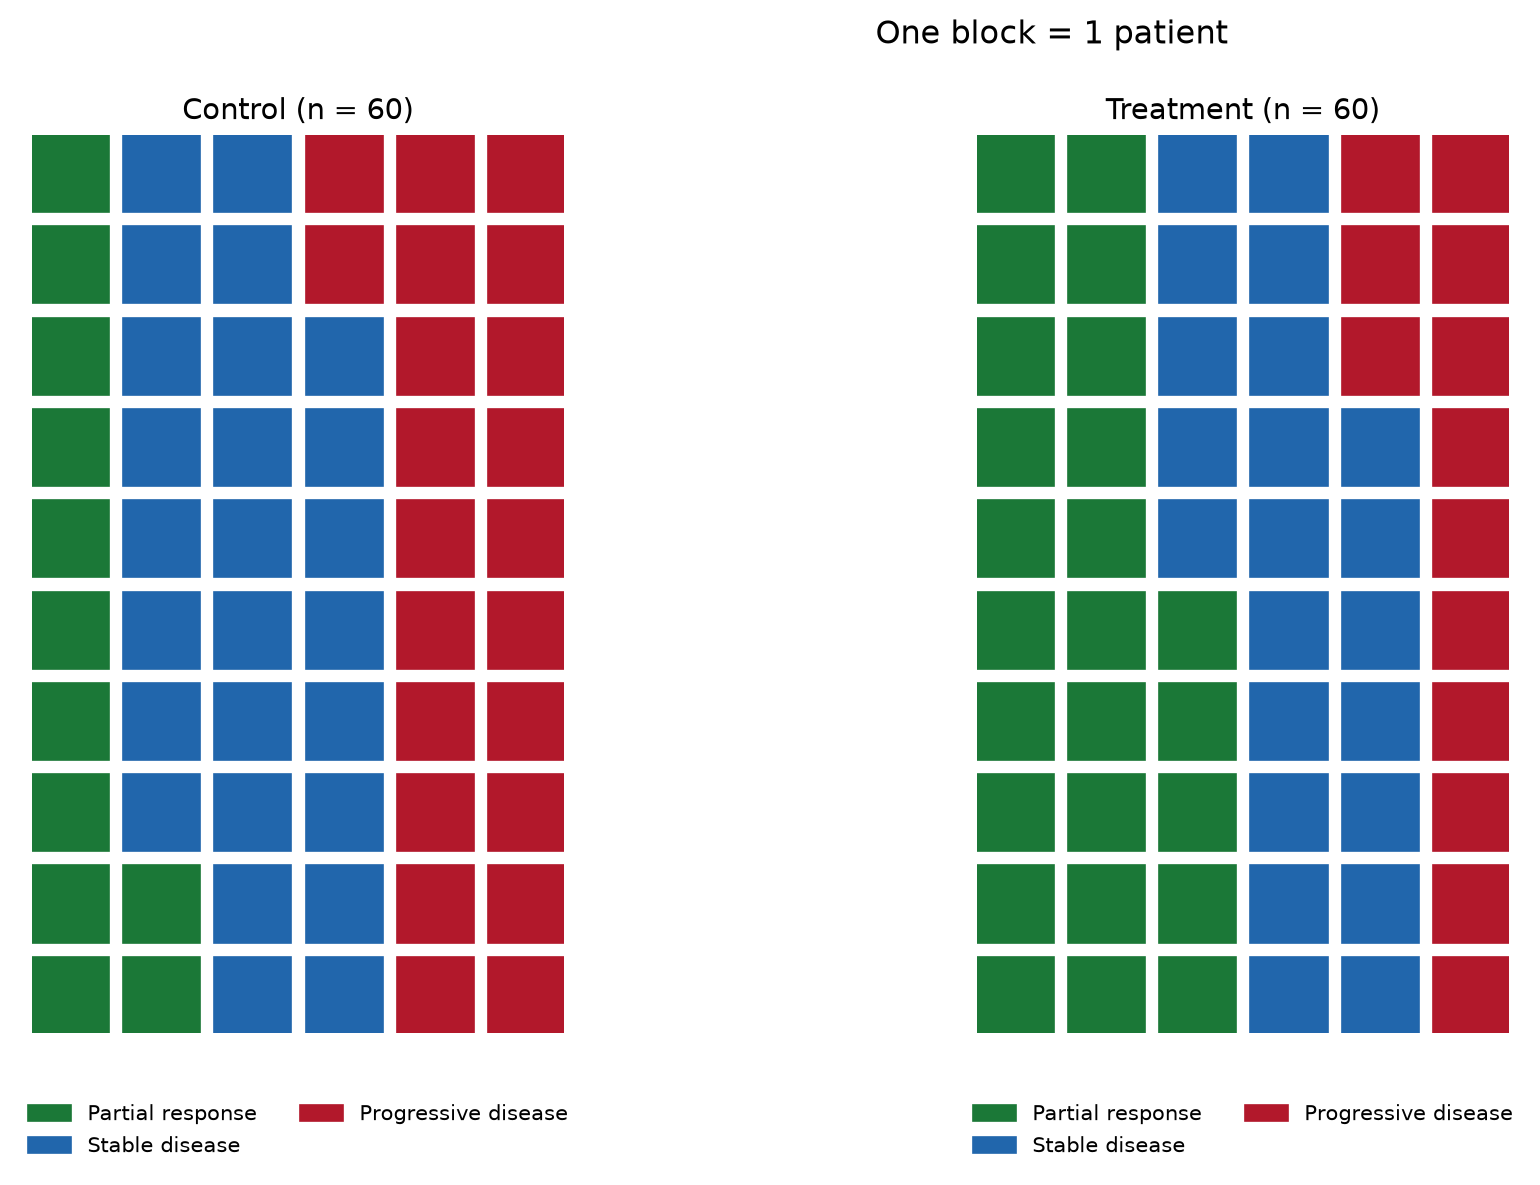
提示实践要点
- 先定方块比例:约 200 例以下用 1 方块 = 1 名患者,以上用 1 方块 = 1%(100 方块)——绝不让库在面板之间悄悄自动缩放。
- 计数转百分比方块时显式取整并注明规则;
round()可能让方块总数变成 99 或 101。 - 多臂共用一套配色和图例,让方块而不是颜色承载比较。
- 华夫图只表达构成——分母重要时把计数写进标签。
- 有序类别(RECIST)在多图间保持一致的颜色方向;无序类别使用色盲安全色。
Application
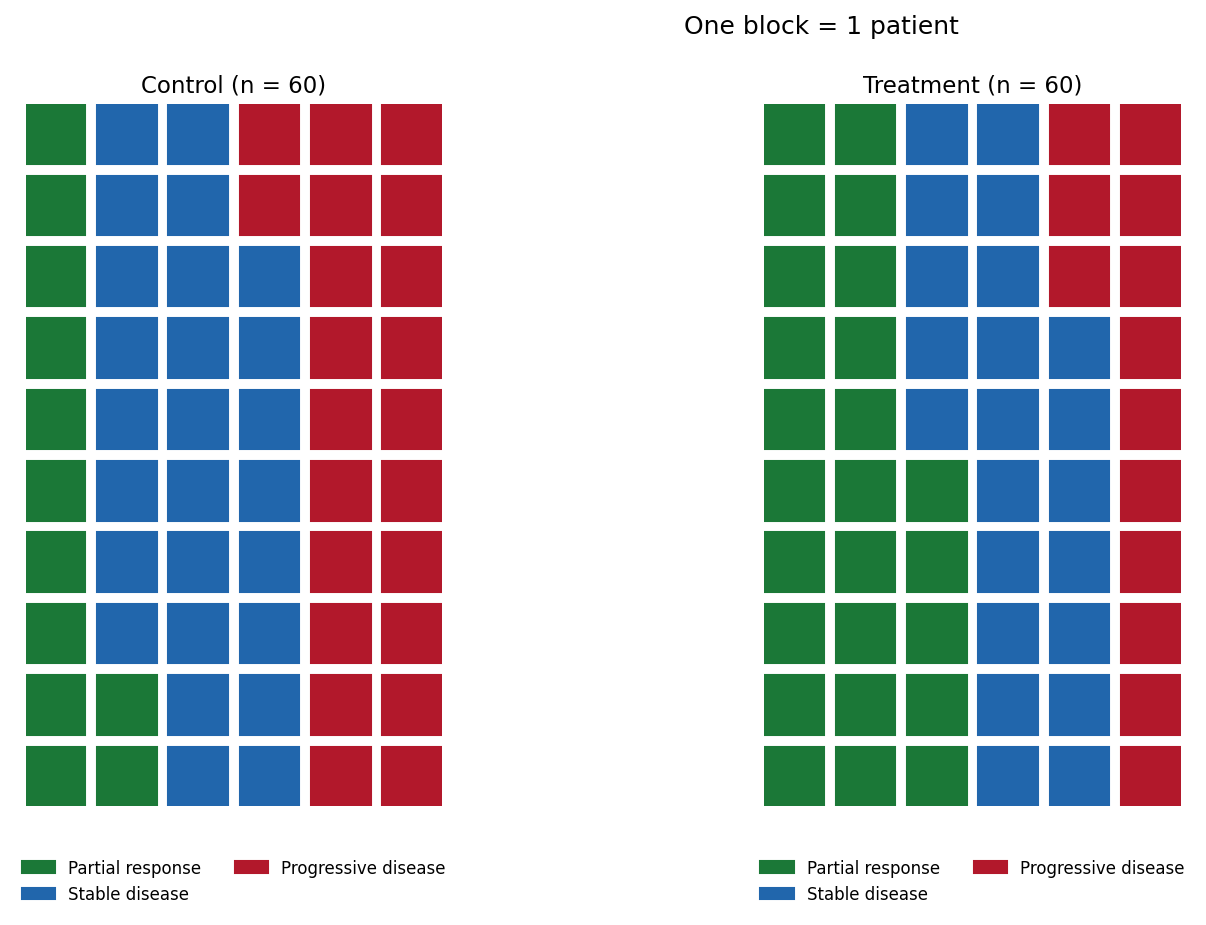
大队列时把方块比例切换为 1 方块 = 1%,华夫图就变成直接的客观缓解率(ORR)陈述:下图 37 个绿色方块就是 ORR 本身——这也是华夫图在患者沟通材料和研究海报中好用的原因。
Reference
[1] Cleveland WS, McGill R. Graphical perception: theory, experimentation, and application to the development of graphical methods. J Am Stat Assoc. 1984;79(387):531-554. doi:10.1080/01621459.1984.10478080
[2] Liu G. PyWaffle: waffle charts in matplotlib. 2024. https://github.com/gyli/PyWaffle