# 安装必要的包
if (!requireNamespace("Rtsne", quietly = TRUE)) {
  install.packages("Rtsne")
}
if (!requireNamespace("patchwork", quietly = TRUE)) {
  install.packages("patchwork")
}

# 加载包
library(Rtsne)
library(ggplot2)
library(dplyr)
library(patchwork)t-SNE 图
t 分布随机邻域嵌入(t-SNE)把高维数据——每个细胞数千个基因、每个样本数百个特征——投影到保持”邻近观测相互靠近”的二维地图上 [1]。它是单细胞基因组学的主力嵌入方法:在两万个维度的表达空间中分离的细胞类型,在 t-SNE 平面上呈现为肉眼可见的”岛屿”,使群体结构一目了然。
t-SNE 回答的是结构问题(“有多少个群体、谁与谁相邻”),而不是距离问题:图上簇间距离与簇大小不具备全局含义,且图形随 perplexity 超参数和随机种子而变。PCA 保留全局几何但只能捕捉线性结构——两者互补,标准做法是在前若干个主成分上运行 t-SNE,而非直接在原始特征上 [2]。
本教程涵盖 Rtsne [3] 的四种实用工作流:
- 模拟单细胞表达矩阵的基础 t-SNE 地图;
-
perplexity如何重塑图形(最需要检查的单一参数); - 同一数据上的 t-SNE 与 PCA 对比;
- 将标记基因表达叠加到地图上。
Example
Setup
系统要求:跨平台(Linux/MacOS/Windows)
编程语言:R
依赖包:
Rtsne;ggplot2;dplyr;patchwork
sessioninfo::session_info("attached")─ Session info ───────────────────────────────────────────────────────────────
setting value
version R version 4.6.2 (2026-10-29)
os Ubuntu 24.04.5 LTS
system x86_64, linux-gnu
ui X11
language (EN)
collate C.UTF-8
ctype C.UTF-8
tz UTC
date 2026-10-31
pandoc 3.1.3 @ /usr/bin/ (via rmarkdown)
quarto 1.10.20 @ /usr/local/bin/quarto
─ Packages ───────────────────────────────────────────────────────────────────
! package * version date (UTC) lib source
P dplyr * 1.2.1 2026-04-03 [?] RSPM
P ggplot2 * 4.0.3.9000 2026-10-30 [?] Github (tidyverse/ggplot2@b638d65)
P patchwork * 1.3.2 2025-08-25 [?] RSPM
P Rtsne * 0.17 2023-12-07 [?] RSPM
[1] /home/runner/.cache/R/renv/library/Bizard-5140bdc6/linux-ubuntu-noble/R-4.6/x86_64-pc-linux-gnu
[2] /home/runner/work/_temp/Library
[3] /opt/R/4.6.2/lib/R/library
* ── Packages attached to the search path.
P ── Loaded and on-disk path mismatch.
──────────────────────────────────────────────────────────────────────────────Data Preparation
我们模拟类似 scRNA-seq 的对数表达矩阵:1,200 个细胞来自四个群体(CD4 T 细胞、B 细胞、NK 细胞、单核细胞)× 200 个基因,每个群体特异表达一段 20 基因的标记块。四个群体仅靠标记块区分——这正是 t-SNE 应当还原为四个岛屿的结构。
set.seed(251)

n_per   <- 300
types   <- c("CD4 T cells", "B cells", "NK cells", "Monocytes")
n_genes <- 200

base <- matrix(rnorm(n_per * length(types) * n_genes, 0, 0.6),
               nrow = n_per * length(types), ncol = n_genes,
               dimnames = list(NULL, paste0("Gene", 1:n_genes)))
ct <- rep(types, each = n_per)
markers <- list("CD4 T cells" = 1:20, "B cells" = 21:40,
                "NK cells" = 41:60, "Monocytes" = 61:80)
for (t in types) {
  idx <- which(ct == t)
  base[idx, markers[[t]]] <- base[idx, markers[[t]]] + 2.5
}
expr <- pmax(base + rnorm(length(base), 0, 0.3), 0)

# 标准做法:在前若干主成分上运行 t-SNE,而非原始基因
pcs <- prcomp(expr, rank. = 30)$x[, 1:30]
Visualization
1. 基础 t-SNE 地图
set.seed(251)                       # t-SNE 是随机算法:固定种子
tsne30 <- Rtsne(pcs, dims = 2, perplexity = 30, pca = FALSE, verbose = FALSE)

d30 <- data.frame(tSNE1 = tsne30$Y[, 1], tSNE2 = tsne30$Y[, 2], celltype = ct)
cent <- d30 |>
  group_by(celltype) |>
  summarise(tSNE1 = mean(tSNE1), tSNE2 = mean(tSNE2))

pal <- c("#4E79A7", "#F28E2B", "#E15759", "#76B7B2")
p1 <- ggplot(d30, aes(tSNE1, tSNE2, color = celltype)) +
  geom_point(size = 0.7, alpha = 0.8) +
  geom_text(data = cent, aes(tSNE1, tSNE2, label = celltype),
            inherit.aes = FALSE, color = "black",
            fontface = "bold", size = 3.5, vjust = -1.2) +
  scale_color_manual(values = pal) +
  labs(x = "t-SNE 1", y = "t-SNE 2") +
  theme_bw(base_size = 11) +
  theme(legend.position = "none")
p1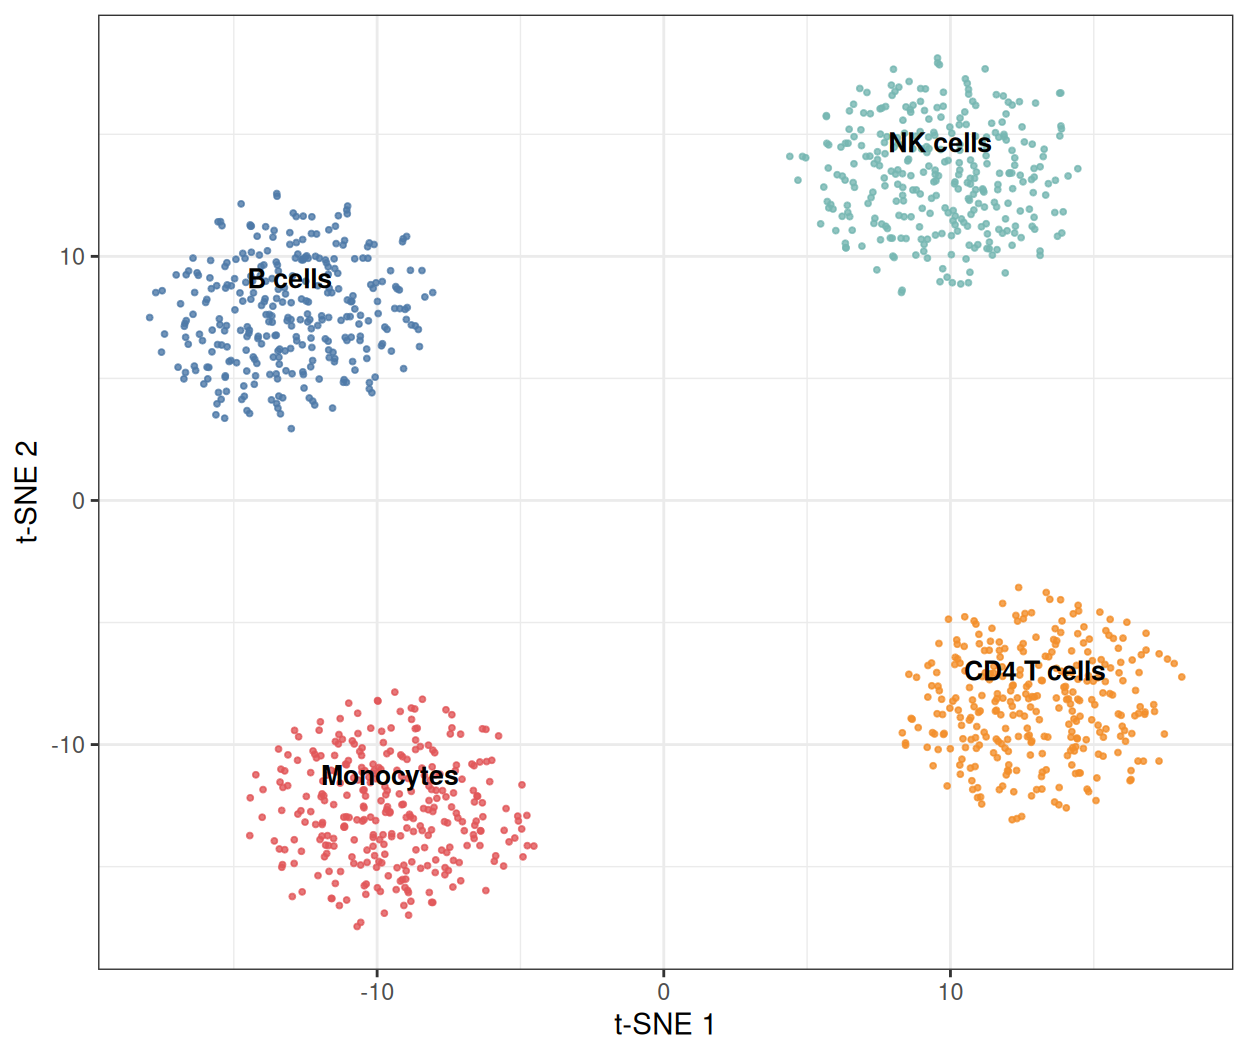
四个岛屿对应四个群体。注意坐标轴:t-SNE 维度没有单位和固定方向——换一个种子重跑,地图会旋转或镜像,但邻域结构保持不变。
2. 困惑度的权衡
perplexity(粗略地说,每个点考虑的”有效邻居数”)是影响最大的单一参数。低值解析局部细节,高值合并群体;数千细胞常用 5–50,诚实的报告应展示图形在一段范围内稳定。
mk <- function(ppl) {
  set.seed(251)
  ts <- Rtsne(pcs, dims = 2, perplexity = ppl, pca = FALSE, verbose = FALSE)
  data.frame(tSNE1 = ts$Y[, 1], tSNE2 = ts$Y[, 2], celltype = ct, perplexity = ppl)
}
dfp <- bind_rows(mk(5), mk(30), mk(100))

ggplot(dfp, aes(tSNE1, tSNE2, color = celltype)) +
  geom_point(size = 0.6, alpha = 0.8) +
  facet_wrap(~perplexity, labeller = labeller(
    perplexity = function(x) paste0("perplexity = ", x))) +
  scale_color_manual(values = pal) +
  labs(x = "t-SNE 1", y = "t-SNE 2") +
  theme_bw(base_size = 11) +
  theme(legend.position = "bottom")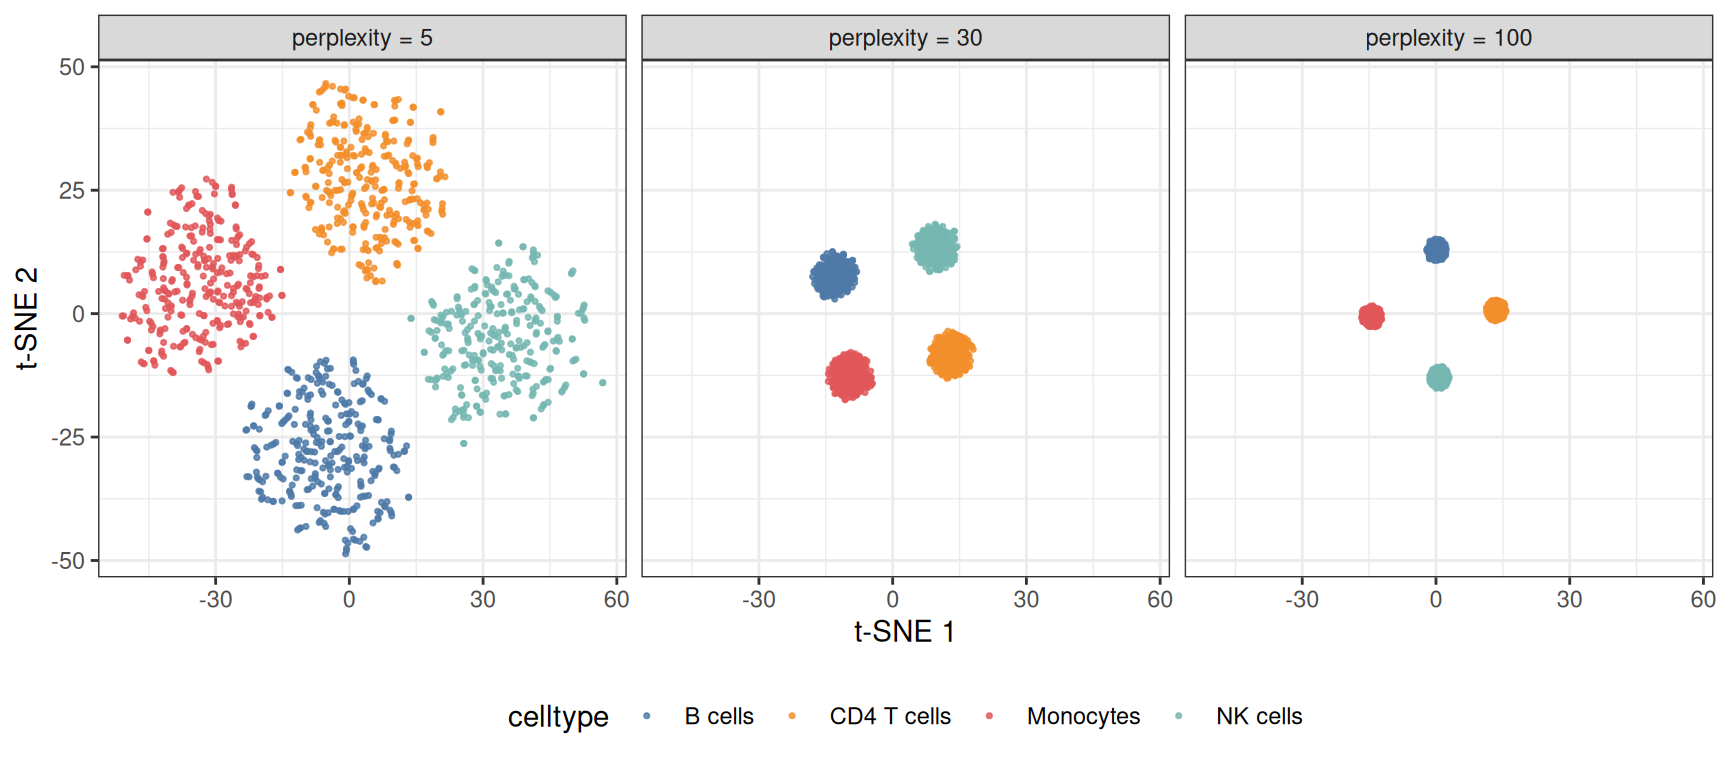
perplexity 为 5 时,标记块的噪声把每个群体碎裂成亚簇;为 100 时四个群体被压成没有结构的团块。解释任何 t-SNE 图时都要把 perplexity 写进图注。
3. t-SNE 与 PCA 对比
pdf <- data.frame(PC1 = pcs[, 1], PC2 = pcs[, 2], celltype = ct)
p3a <- ggplot(pdf, aes(PC1, PC2, color = celltype)) +
  geom_point(size = 0.6, alpha = 0.8) +
  scale_color_manual(values = pal) +
  labs(x = "PC 1", y = "PC 2", title = "PCA (linear)") +
  theme_bw(base_size = 11) + theme(legend.position = "none")
p3b <- p1 + labs(title = "t-SNE (nonlinear)")

p3a / p3b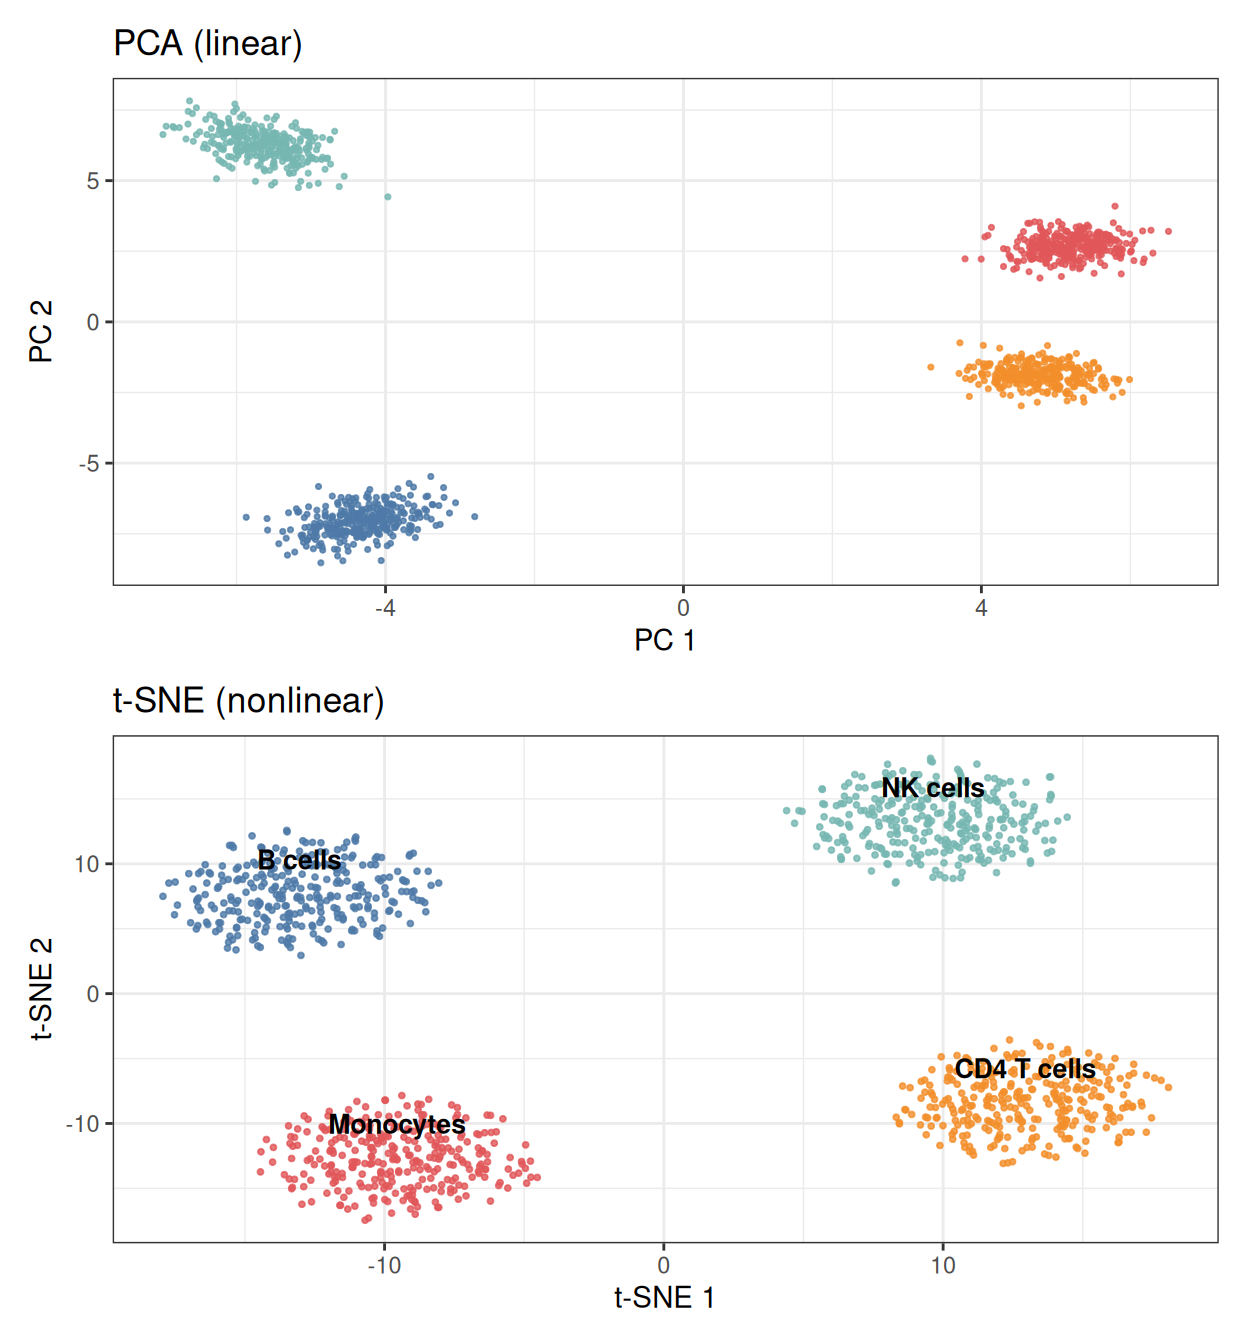
PCA 保留群体的真实相对大小与位置;t-SNE 均衡簇面积并拉伸空间使邻居贴合。需要量级与梯度信息(轨迹端点、批次偏移)用 PCA,需要发现群体结构用 t-SNE。
4. 叠加标记基因表达
dfm <- d30
dfm$marker <- expr[, "Gene1"]          # CD4 T 细胞标记块成员

ggplot(dfm, aes(tSNE1, tSNE2, color = marker)) +
  geom_point(size = 0.7, alpha = 0.9) +
  scale_color_gradient(low = "#EEEEEE", high = "#B2182B", name = "Gene1") +
  labs(x = "t-SNE 1", y = "t-SNE 2") +
  theme_bw(base_size = 11)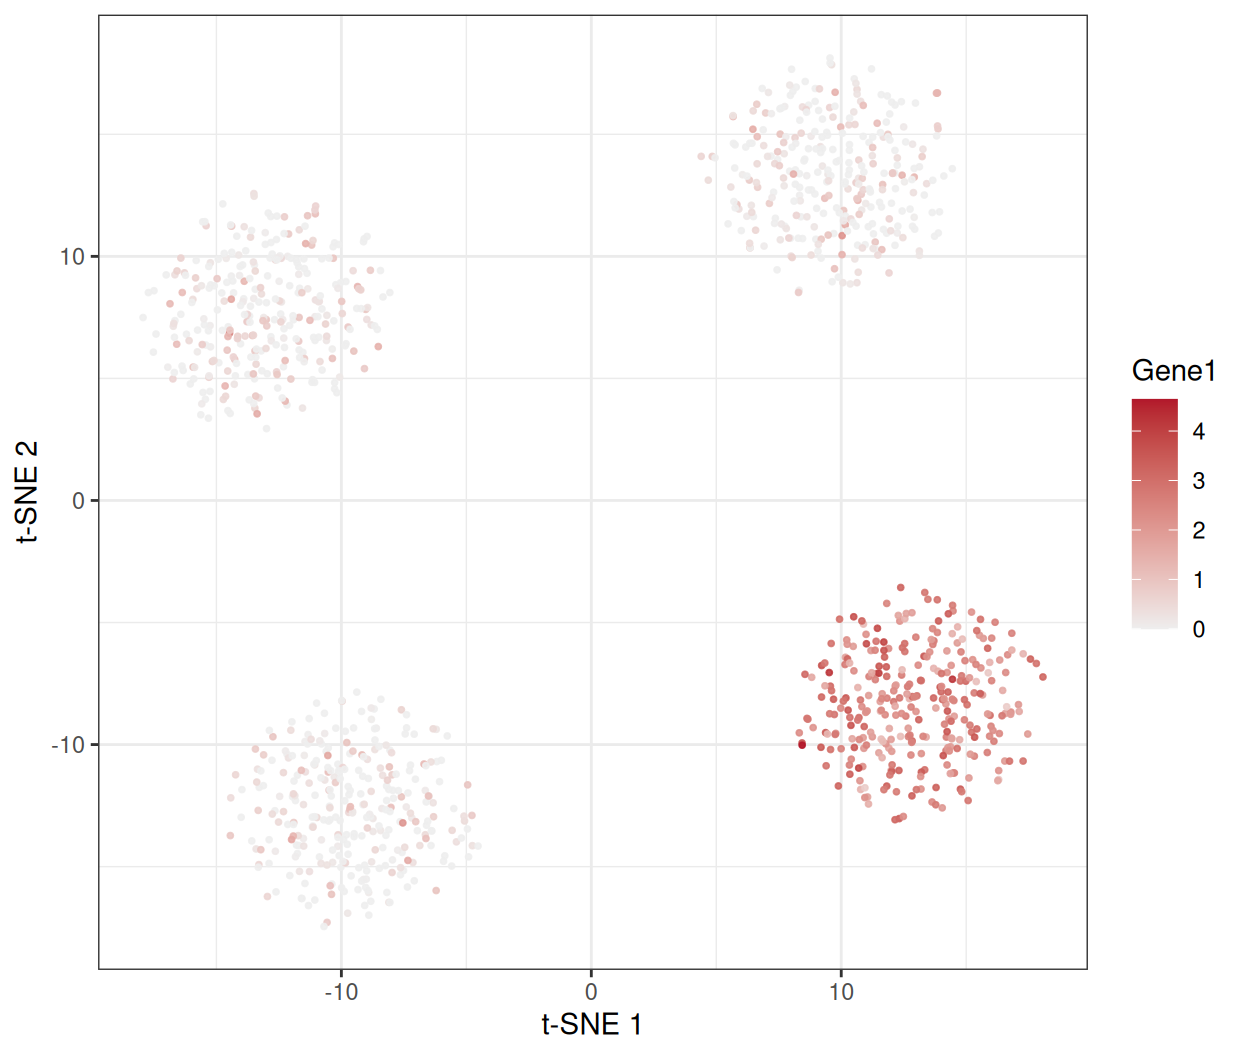
把每细胞数值(基因表达、打分、QC 指标)画上地图,正是 t-SNE 图获得解释力的方式。
提示实践要点
-
Rtsne()之前务必set.seed()——优化过程是随机的,不设种子的地图不可复现。 - 输入前 20–50 个 PC 而非原始特征:先去噪是”结构”与”噪声”的分界(还快得多)。
- 报告 perplexity;在至少两个取值下确认簇边界再下结论。
- 切勿解读全局距离:地图上相距很远的两个岛屿未必比相邻的两个”差异更大”。
- t-SNE 无法把新样本嵌入已有地图——需要增量嵌入用 UMAP,否则只能重新拟合。
Application
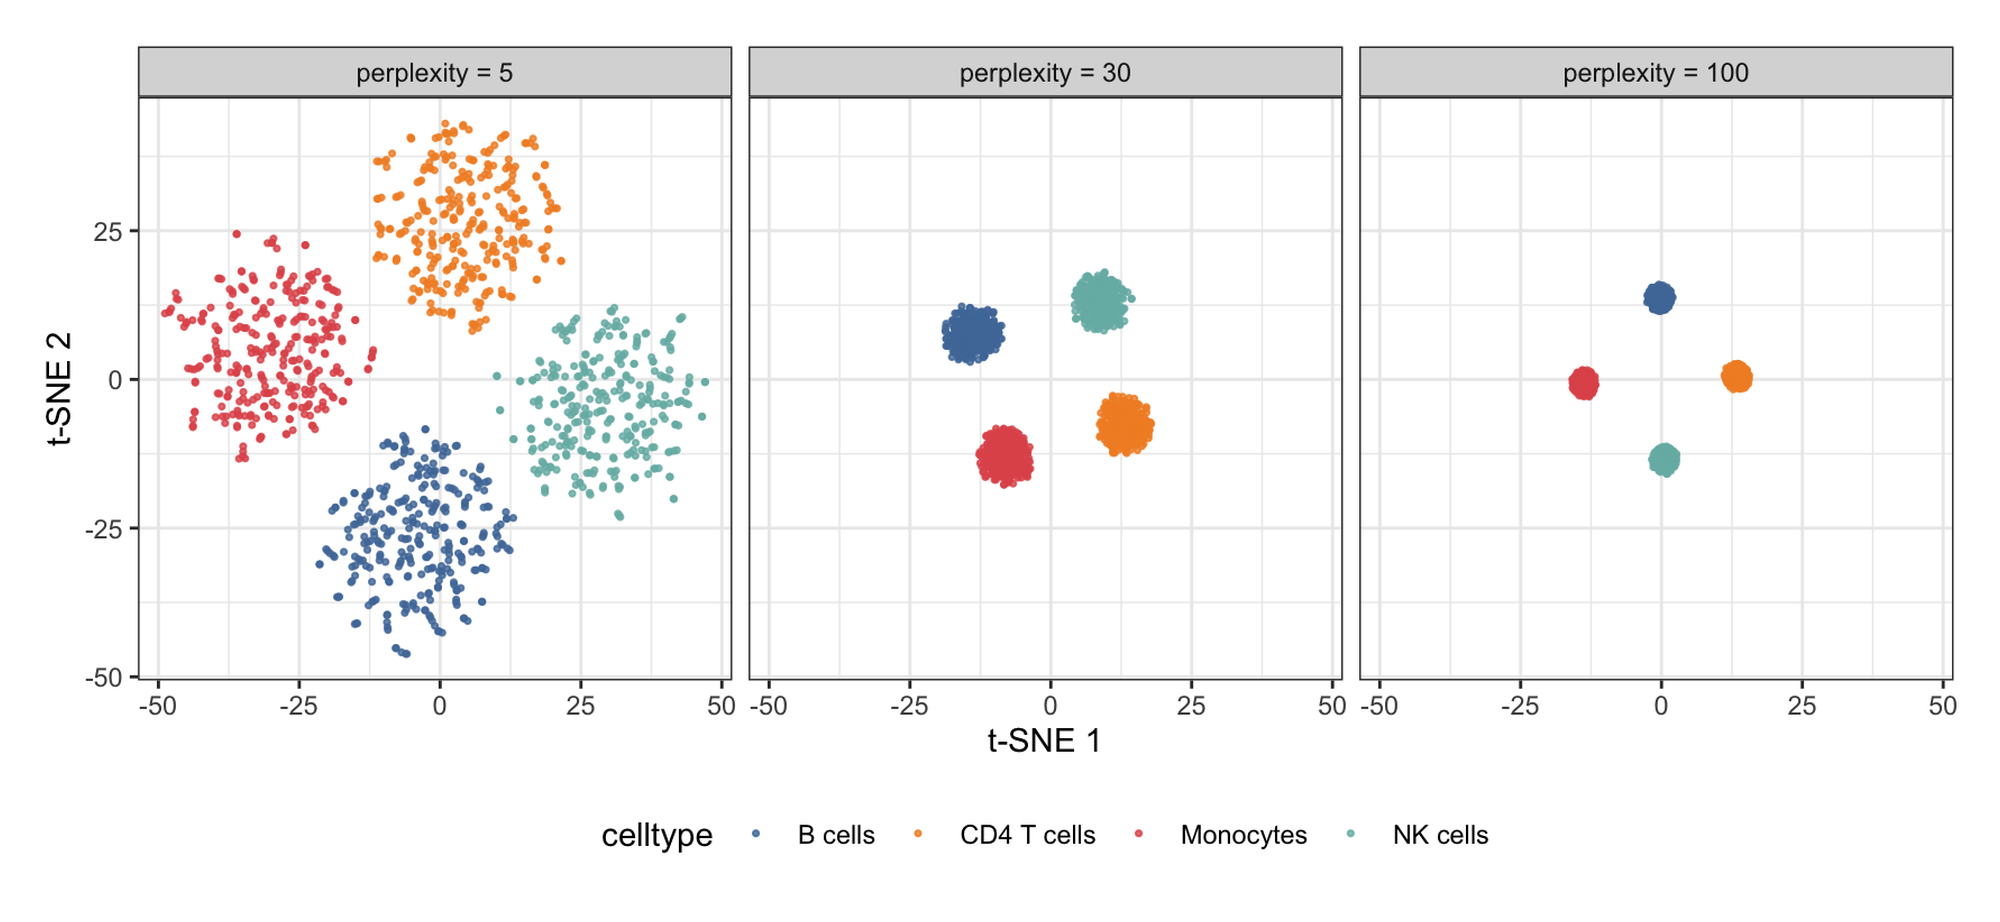
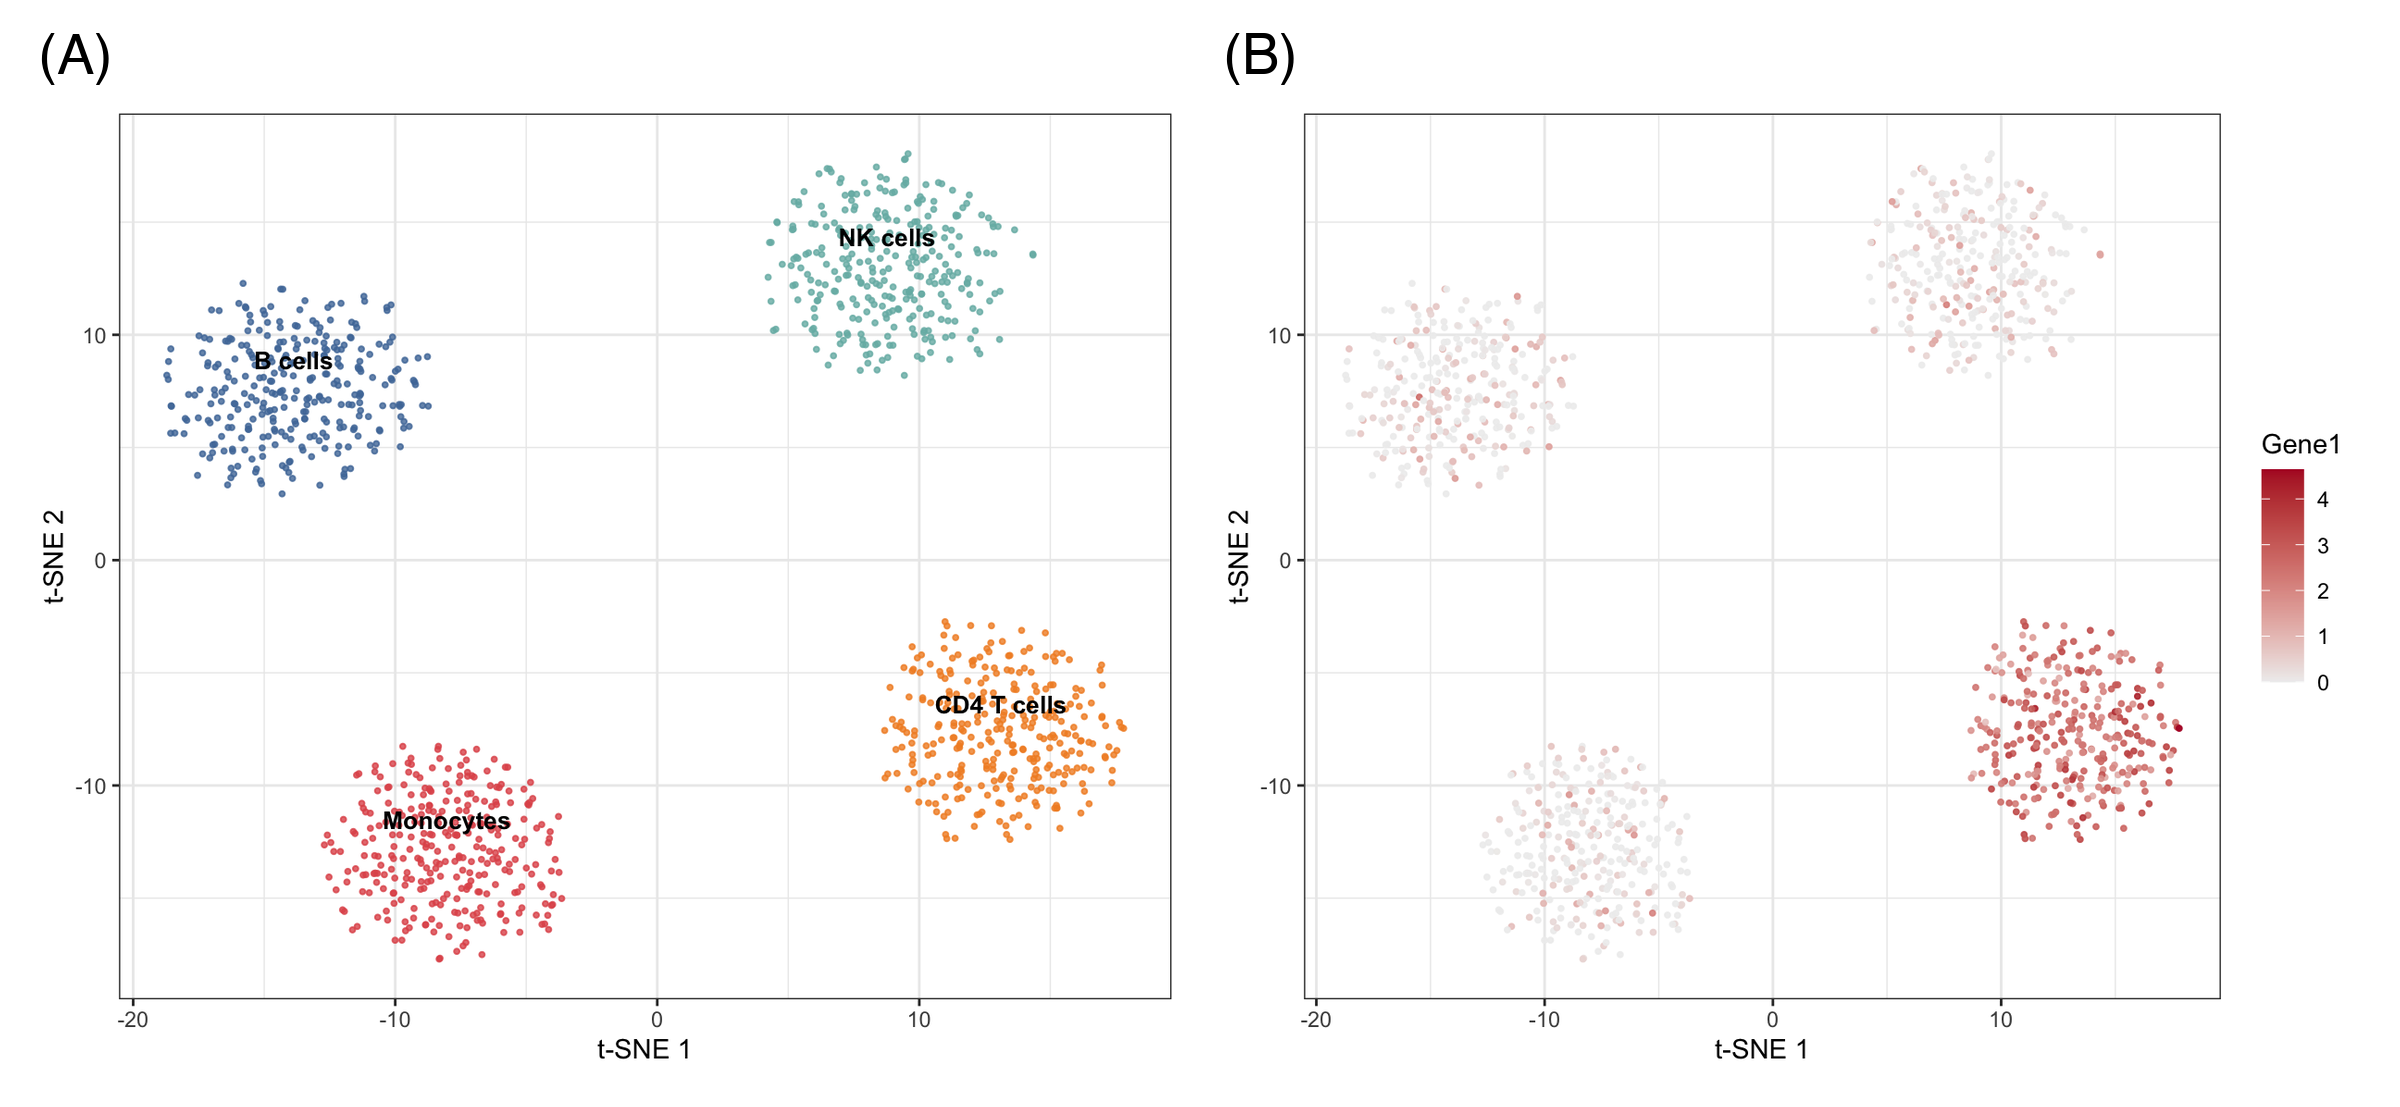
t-SNE 地图是单细胞论文的门面图(细胞类型图谱、肿瘤免疫浸润),凡需把大量特征压缩为群体地图的场景均适用:流式细胞面板、甲基化谱、药物筛选形态学。下图模拟典型论文版式:(A) 困惑度检查与 (B) 带标记叠加的群体地图。
Reference
[1] van der Maaten L, Hinton G. Visualizing data using t-SNE. J Mach Learn Res. 2008;9:2579-2605.
[2] Kobak D, Berens P. The art of using t-SNE for single-cell transcriptomics. Nat Commun. 2019;10:5416. doi:10.1038/s41467-019-13056-x
[3] Krijthe JH. Rtsne: t-Distributed Stochastic Neighbor Embedding using Barnes-Hut implementation. R package version 0.17. 2015. https://github.com/jkrijthe/Rtsne