# 如有需要,安装 Bioconductor 管理器
if (!requireNamespace("BiocManager", quietly = TRUE)) {
  install.packages("BiocManager")
}

# 安装 CRAN 依赖
if (!requireNamespace("ggplot2", quietly = TRUE)) install.packages("ggplot2")
if (!requireNamespace("circlize", quietly = TRUE)) install.packages("circlize")
if (!requireNamespace("igraph", quietly = TRUE)) install.packages("igraph")

# 从 GitHub 安装 CellChat(jinworks/CellChat 为当前维护版本)
if (!requireNamespace("CellChat", quietly = TRUE)) {
  if (!requireNamespace("remotes", quietly = TRUE)) install.packages("remotes")
  remotes::install_github("jinworks/CellChat")
}

# 加载包
library(CellChat)
library(ggplot2)
library(circlize)细胞-细胞通讯网络圈图
细胞-细胞通讯网络圈图是一种专用于描绘来自单细胞 RNA 测序(scRNA-seq)数据推断的细胞间信号交互的可视化方法。使用 CellChat R 包,该图以圆形网络的形式展示,其中节点代表细胞群(细胞类型或细胞簇),有向边表示细胞类型之间配体-受体通讯信号的强度和方向。
每条边的弧宽编码通讯概率,每个节点上的自环代表自分泌信号。颜色编码将每种细胞类型映射到不同颜色,箭头方向显示发送者-接收者关系。该可视化方法特别适用于发现免疫细胞与肿瘤细胞之间的交叉信号,识别组织微环境中的关键信号中枢,以及比较不同生物学条件下的通讯网络。
示例
环境配置
系统要求:跨平台(Linux/MacOS/Windows)
编程语言:R
依赖包:
CellChat、ggplot2、circlize
sessioninfo::session_info("attached")─ Session info ───────────────────────────────────────────────────────────────
setting value
version R version 4.6.0 (2026-04-24)
os Ubuntu 24.04.4 LTS
system x86_64, linux-gnu
ui X11
language (EN)
collate C.UTF-8
ctype C.UTF-8
tz UTC
date 2026-05-09
pandoc 3.1.3 @ /usr/bin/ (via rmarkdown)
quarto 1.9.37 @ /usr/local/bin/quarto
─ Packages ───────────────────────────────────────────────────────────────────
package * version date (UTC) lib source
Biobase * 2.72.0 2026-04-28 [1] Bioconduc~
BiocGenerics * 0.58.0 2026-04-28 [1] Bioconduc~
CellChat * 2.2.0.9001 2026-05-04 [1] Github (jinworks/CellChat@75253cd)
circlize * 0.4.18 2026-04-04 [1] RSPM
dplyr * 1.2.1 2026-04-03 [1] RSPM
generics * 0.1.4 2025-05-09 [1] RSPM
ggplot2 * 4.0.3.9000 2026-05-04 [1] Github (tidyverse/ggplot2@6870419)
igraph * 2.3.1 2026-05-04 [1] RSPM
[1] /home/runner/work/_temp/Library
[2] /opt/R/4.6.0/lib/R/site-library
[3] /opt/R/4.6.0/lib/R/library
* ── Packages attached to the search path.
──────────────────────────────────────────────────────────────────────────────数据准备
本教程使用模拟的 CellChat 兼容通讯矩阵,使示例完全自包含,无需外部数据集或模型推断即可运行。对于使用真实 CellChat 对象(由您自己的 scRNA-seq 数据生成)的用户,相同的可视化代码同样适用。
# 模拟通讯计数/权重矩阵
# 在实际使用中,这些数据来自 cellchat@net$count 和 cellchat@net$weight

set.seed(42)
cell_types <- c("CD4 T", "CD8 T", "NK", "B cell", "Monocyte",
                "DC", "Fibroblast", "Epithelial", "Endothelial")
n <- length(cell_types)

net_count  <- matrix(sample(0:50, n * n, replace = TRUE), n, n,
                     dimnames = list(cell_types, cell_types))
net_weight <- matrix(runif(n * n, 0, 1), n, n,
                     dimnames = list(cell_types, cell_types))
diag(net_count)  <- 0  # 移除自分泌通讯
diag(net_weight) <- 0

# 每种细胞类型的细胞数量(模拟)
group_size <- sample(50:500, n, replace = TRUE)
names(group_size) <- cell_types

cat("模拟了", n, "种细胞类型,共", sum(net_count), "次交互\n")
模拟了 9 种细胞类型,共 1875 次交互print(net_count) CD4 T CD8 T NK B cell Monocyte DC Fibroblast Epithelial Endothelial
CD4 T 0 23 46 4 29 44 48 37 41
CD8 T 36 0 2 19 42 27 25 9 8
NK 0 35 0 33 14 4 49 39 28
B cell 24 24 24 0 21 3 5 4 11
Monocyte 9 36 26 39 0 33 5 32 19
DC 35 45 35 2 35 0 1 48 8
Fibroblast 17 19 36 32 3 34 0 38 42
Epithelial 48 25 30 41 21 23 20 0 34
Endothelial 46 49 44 23 17 22 1 44 0使用自有数据构建 CellChat 对象(参考代码)
以下代码仅供参考(eval: false),展示如何从 Seurat scRNA-seq 对象构建 CellChat 对象,然后进行下方的可视化。
library(Seurat)
library(CellChat)

# 1. 从 Seurat 对象提取标准化计数矩阵和元数据
seurat_obj  <- readRDS("your_seurat_object.rds")
data_input  <- GetAssayData(seurat_obj, assay = "RNA", slot = "data")
meta        <- seurat_obj@meta.data

# 2. 创建 CellChat 对象
cellchat <- createCellChat(object = data_input, meta = meta, group.by = "cell_type")

# 3. 设置配体-受体数据库
cellchat@DB <- CellChatDB.human  # 小鼠数据使用 CellChatDB.mouse

# 4. 预处理与推断通讯
cellchat <- subsetData(cellchat)
cellchat <- identifyOverExpressedGenes(cellchat)
cellchat <- identifyOverExpressedInteractions(cellchat)
cellchat <- computeCommunProb(cellchat, type = "triMean")
cellchat <- filterCommunication(cellchat, min.cells = 10)
cellchat <- computeCommunProbPathway(cellchat)
cellchat <- aggregateNet(cellchat)
# 此后 cellchat@net$count 和 cellchat@net$weight 即可用于绘图
可视化
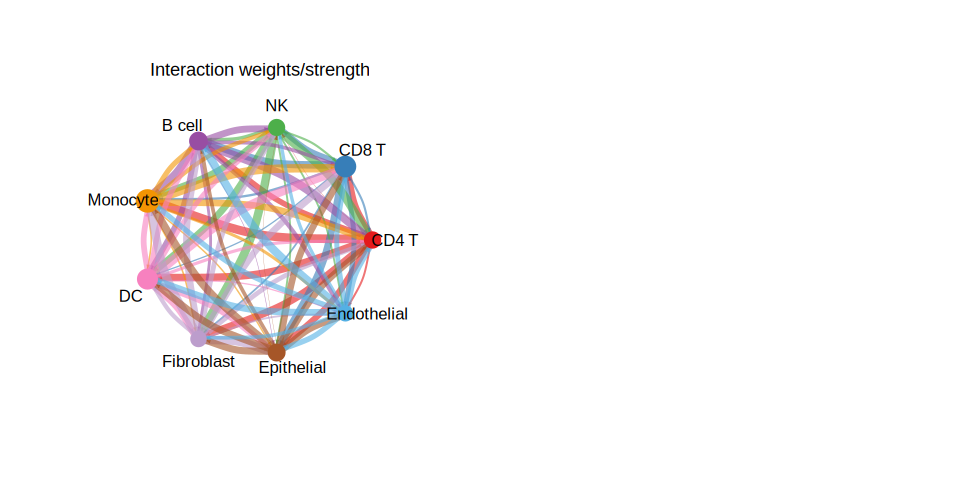
1. 整体细胞-细胞通讯圈图
整体圈图汇总所有推断的通讯交互。每个节点代表一种细胞类型;节点大小与该细胞类型参与的交互数量成正比。弧宽编码通讯强度。
par(mfrow = c(1, 2), xpd = TRUE)

# 面板 A:交互数量
netVisual_circle(
  net_count,
  vertex.weight = group_size,
  weight.scale  = TRUE,
  label.edge    = FALSE,
  title.name    = "交互数量"
)

# 面板 B:交互强度(权重)
netVisual_circle(
  net_weight,
  vertex.weight = group_size,
  weight.scale  = TRUE,
  label.edge    = FALSE,
  title.name    = "交互权重/强度"
)
par(mfrow = c(1, 1))2. 单细胞类型通讯圈图
逐行对权重矩阵进行子集化,分别展示每种细胞类型的输出信号。
n_types <- nrow(net_weight)
n_cols  <- ceiling(sqrt(n_types))
n_rows  <- ceiling(n_types / n_cols)

par(mfrow = c(n_rows, n_cols), xpd = TRUE, mar = c(1, 1, 2, 1))

for (i in seq_len(n_types)) {
  mat_i          <- matrix(0, nrow = n_types, ncol = n_types,
                           dimnames = dimnames(net_weight))
  mat_i[i, ]    <- net_weight[i, ]   # 第 i 种细胞类型的输出信号

  netVisual_circle(
    mat_i,
    vertex.weight   = group_size,
    weight.scale    = TRUE,
    edge.weight.max = max(net_weight),
    title.name      = rownames(net_weight)[i]
  )
}
par(mfrow = c(1, 1))3. 弦图
弦图使用 circlize 提供了另一种圆形视图,清晰展示细胞类型对之间的双向通讯量。
chordDiagram(
  net_weight,
  transparency      = 0.4,
  annotationTrack   = "grid",
  preAllocateTracks = 1
)

circos.trackPlotRegion(
  track.index = 1,
  panel.fun   = function(x, y) {
    circos.text(
      CELL_META$xcenter,
      CELL_META$ylim[1] + 0.1,
      CELL_META$sector.index,
      facing     = "clockwise",
      niceFacing = TRUE,
      adj        = c(0, 0.5),
      cex        = 0.7
    )
  },
  bg.border = NA
)

title("细胞-细胞通讯(弦图)")
circos.clear()4. 通讯热图
热图视图可快速识别主要的发送者-接收者细胞对及不对称通讯模式。
df_heat <- as.data.frame(as.table(net_weight))
colnames(df_heat) <- c("发送者", "接收者", "权重")

ggplot(df_heat, aes(x = 接收者, y = 发送者, fill = 权重)) +
  geom_tile(color = "white", linewidth = 0.4) +
  scale_fill_gradient(low = "white", high = "#b74147", name = "权重") +
  theme_minimal(base_size = 11) +
  theme(
    axis.text.x = element_text(angle = 45, hjust = 1),
    panel.grid  = element_blank(),
    plot.title  = element_text(size = 13, face = "bold", hjust = 0.5)
  ) +
  labs(
    title = "细胞-细胞通讯热图",
    x = "接收者", y = "发送者"
  )
参考文献
[1] Jin S, Guerrero-Juarez CF, Zhang L 等. 使用 CellChat 推断和分析细胞-细胞通讯. Nature Communications. 2021;12(1):1088. https://doi.org/10.1038/s41467-021-21246-9
[2] Jin S 等. 基于单细胞转录组系统分析细胞-细胞通讯的 CellChat. Nature Protocols. 2024. https://doi.org/10.1038/s41596-024-01045-4
[3] CellChat GitHub: https://github.com/jinworks/CellChat