import matplotlib.pyplot as plt
import seaborn as sns
import pandas as pd
import numpy as np棒棒糖图与哑铃图(Python)
棒棒糖图用细线加端点的圆点替代条形图中的条形,在保持排序可读性的同时大幅削减图形墨量;哑铃图将每行两个圆点用线段连接,直观呈现两个条件间的变化。在生物医学研究中,棒棒糖图常用于富集条目或效应量的排序展示,哑铃图则用于逐特征比较两个队列、时间点或处理臂。二者均由 matplotlib 的基础线层与散点层组合而成。
示例
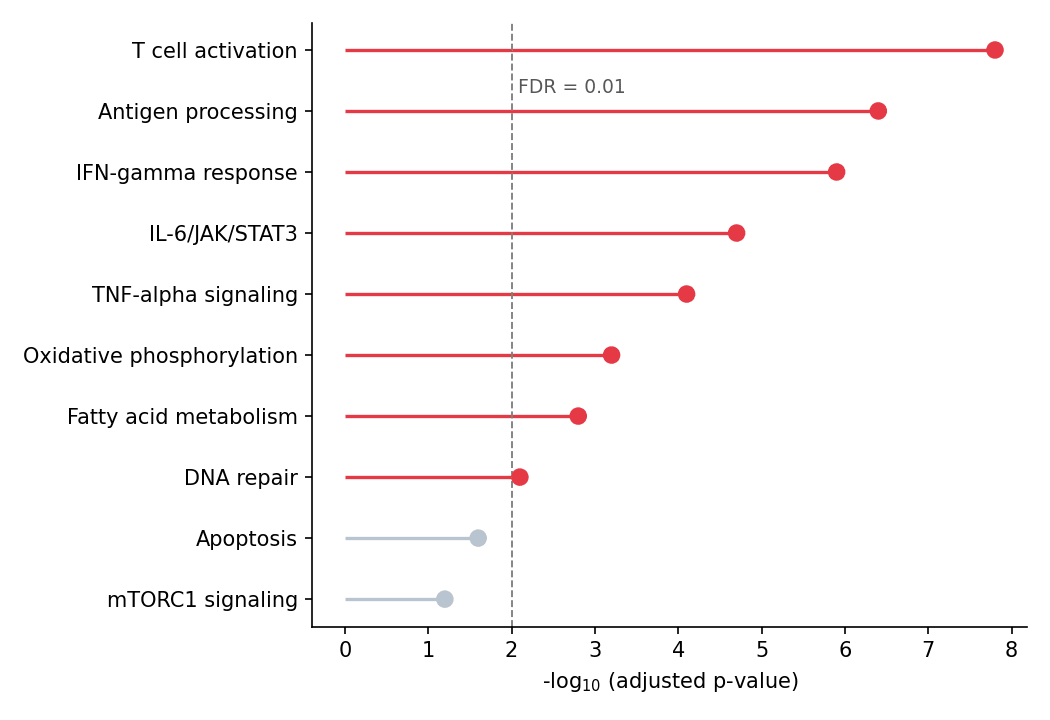
环境配置
- 系统要求:跨平台(Linux/MacOS/Windows)
- 编程语言:Python
- 依赖包:
matplotlib、seaborn、pandas、numpy
数据准备
我们模拟一个通路富集结果(基因集的 −log10 校正 p 值)和一张用于哑铃图的两条件差异表达表。
np.random.seed(51)

pathways = ['T cell activation', 'Antigen processing', 'IFN-gamma response',
            'IL-6/JAK/STAT3', 'TNF-alpha signaling', 'Oxidative phosphorylation',
            'Fatty acid metabolism', 'DNA repair', 'Apoptosis', 'mTORC1 signaling']
enrichment = pd.DataFrame({
    'Pathway': pathways,
    'NegLogFDR': np.array([7.8, 6.4, 5.9, 4.7, 4.1, 3.2, 2.8, 2.1, 1.6, 1.2])
}).sort_values('NegLogFDR')

deseq = pd.DataFrame({
    'Gene': ['CD274', 'IFIT1', 'CXCL10', 'MKI67', 'STAT1', 'IRF1',
             'TGFB1', 'BCL2', 'MYC', 'CD8A'],
    'log2FC_sham': np.array([-0.3, 2.1, 2.8, 0.5, 1.9, 1.6, -0.8, -1.1, 0.9, 0.4]),
    'log2FC_treat': np.array([1.4, 3.9, 4.6, -1.2, 3.3, 2.9, 0.3, -2.6, -1.8, 1.1])
})
可视化
横向棒棒糖图
排序棒棒糖图由 hlines(棒)与 plot 标记(糖)构成;显著条目可用颜色突出显示。
sig = enrichment['NegLogFDR'] >= 2  # -log10(FDR) >= 2  <=>  FDR <= 0.01
colors = np.where(sig, '#e63946', '#b8c4d0')

fig, ax = plt.subplots(figsize=(7, 4.8))
ax.hlines(enrichment['Pathway'], 0, enrichment['NegLogFDR'],
          color=colors, linewidth=1.6)
ax.scatter(enrichment['NegLogFDR'], enrichment['Pathway'],
           color=colors, s=55, zorder=3)
ax.axvline(2, color='0.5', linewidth=0.9, linestyle='--')
ax.text(2.08, 8.3, 'FDR = 0.01', color='0.35', fontsize=9)
ax.set_xlabel('-log$_{10}$ (adjusted p-value)')
ax.spines[['top', 'right']].set_visible(False)
plt.tight_layout()
plt.show()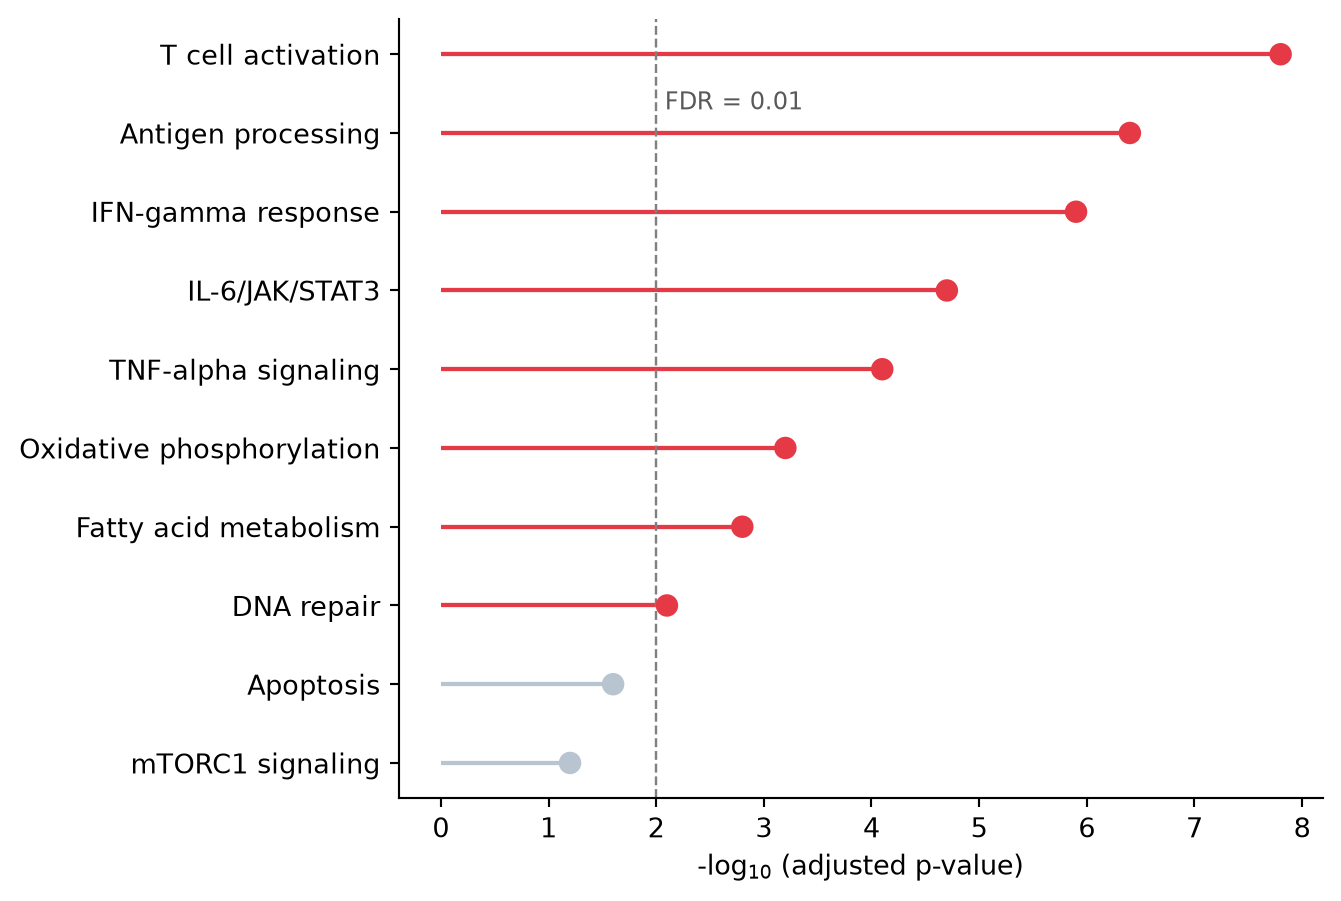
纵向棒棒糖图
同样的构造用 vlines 旋转为纵向,适合标签较短或幻灯片场景。
top8 = enrichment.tail(8)

fig, ax = plt.subplots(figsize=(6.5, 4.4))
ax.vlines(top8['Pathway'], 0, top8['NegLogFDR'],
          color='#8da0cb', linewidth=1.6)
ax.scatter(top8['Pathway'], top8['NegLogFDR'],
           color='#8da0cb', s=55, zorder=3)
ax.set_ylabel('-log$_{10}$ (adjusted p-value)')
ax.tick_params(axis='x', rotation=45)
for label in ax.get_xticklabels():
    label.set_ha('right')
ax.spines[['top', 'right']].set_visible(False)
plt.tight_layout()
plt.show()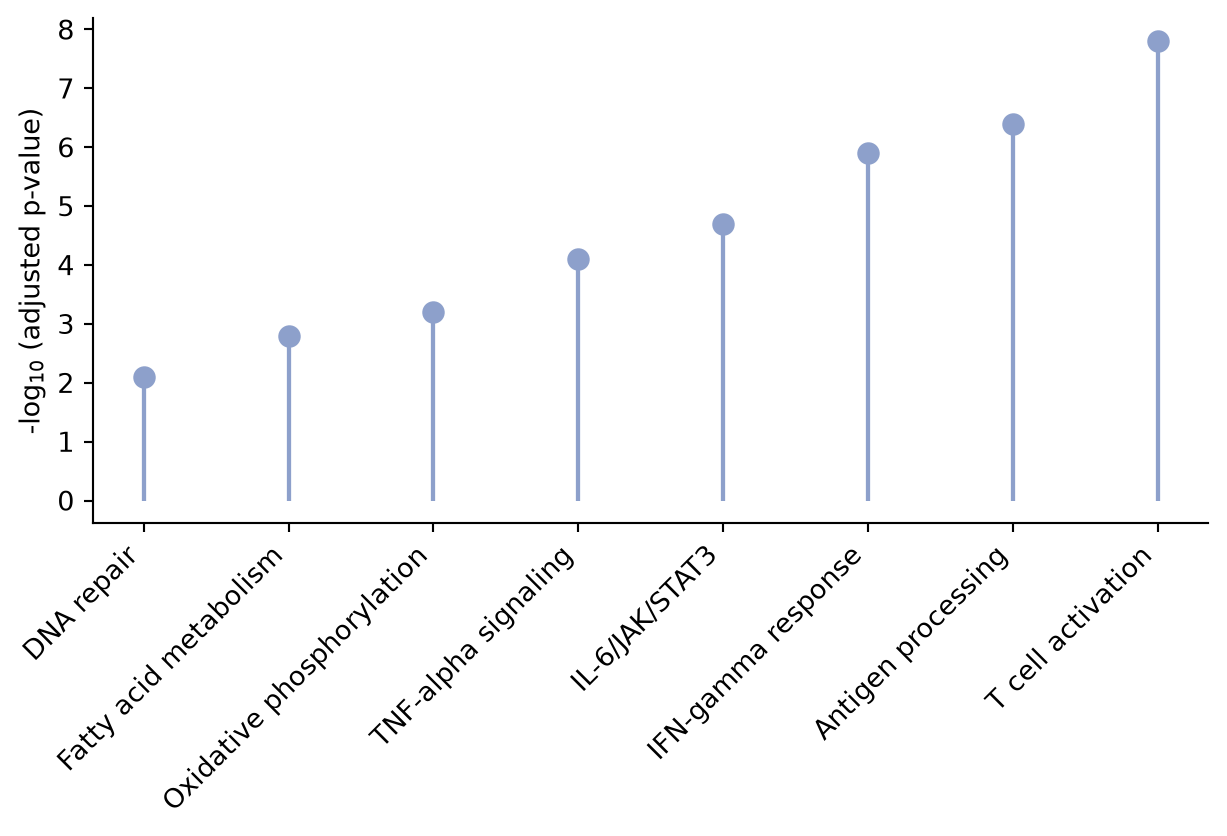
哑铃图
每个基因一条线段连接两个条件的倍数变化;两端圆点按条件着色,使变化的方向与幅度一目了然。
d = deseq.sort_values('log2FC_treat')

fig, ax = plt.subplots(figsize=(7, 4.8))
ax.hlines(d['Gene'], d['log2FC_sham'], d['log2FC_treat'],
          color='0.75', linewidth=2)
ax.scatter(d['log2FC_sham'], d['Gene'], color='#457b9d', s=55,
           label='Sham', zorder=3)
ax.scatter(d['log2FC_treat'], d['Gene'], color='#e63946', s=55,
           label='Treatment', zorder=3)
ax.axvline(0, color='0.4', linewidth=0.9)
ax.set_xlabel('log$_{2}$ fold change')
ax.legend(frameon=False, loc='lower right')
ax.spines[['top', 'right']].set_visible(False)
plt.tight_layout()
plt.show()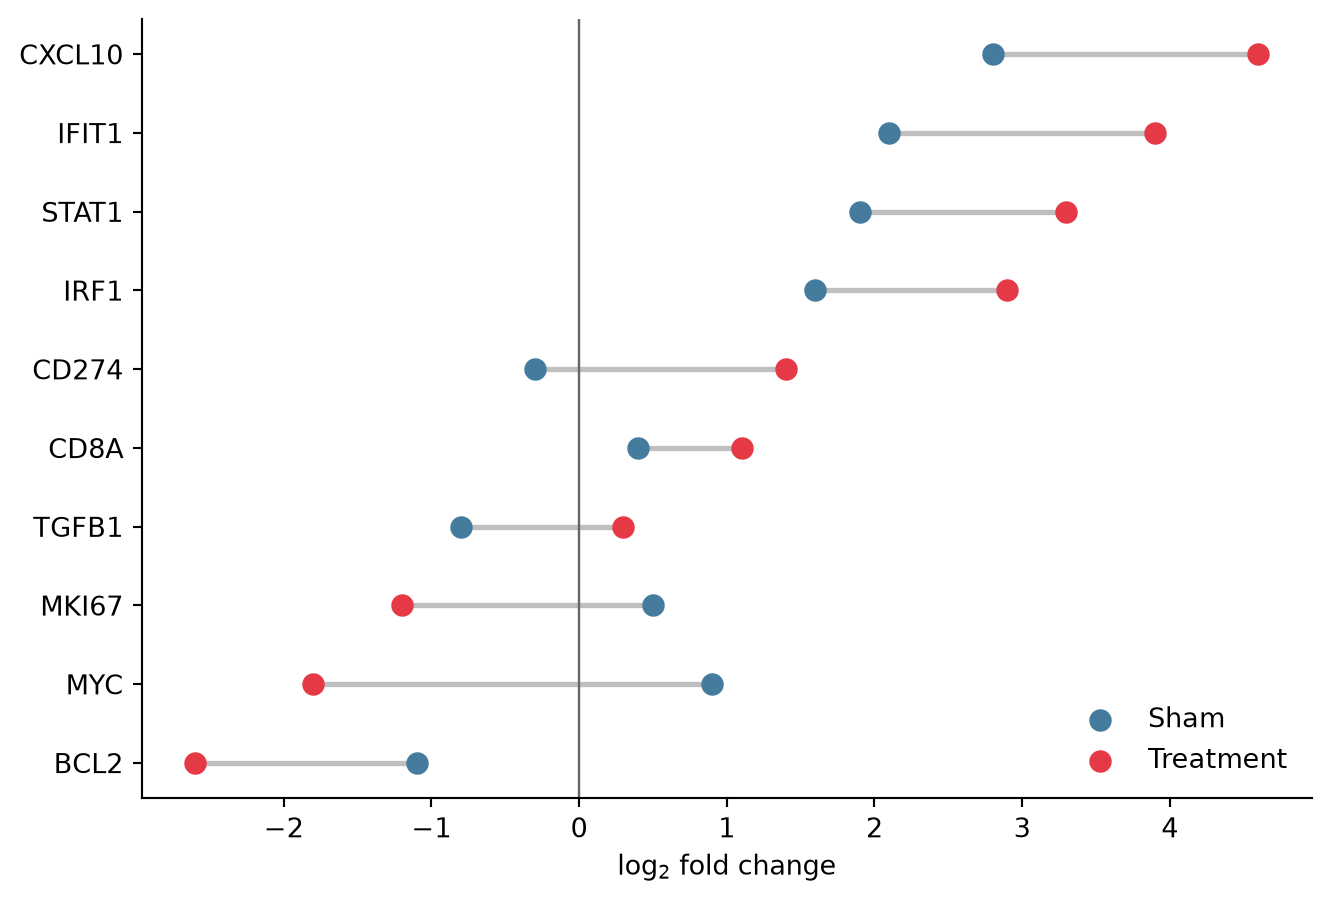
参考文献
- Hunter, J. D. (2007). Matplotlib: A 2D graphics environment. Computing in Science & Engineering, 9(3), 90-95.
- From Data to Viz. Lollipop plot. https://www.data-to-viz.com/graph/lollipop.html