import pandas as pd
import numpy as np
import plotly.graph_objects as go桑基图(Python)
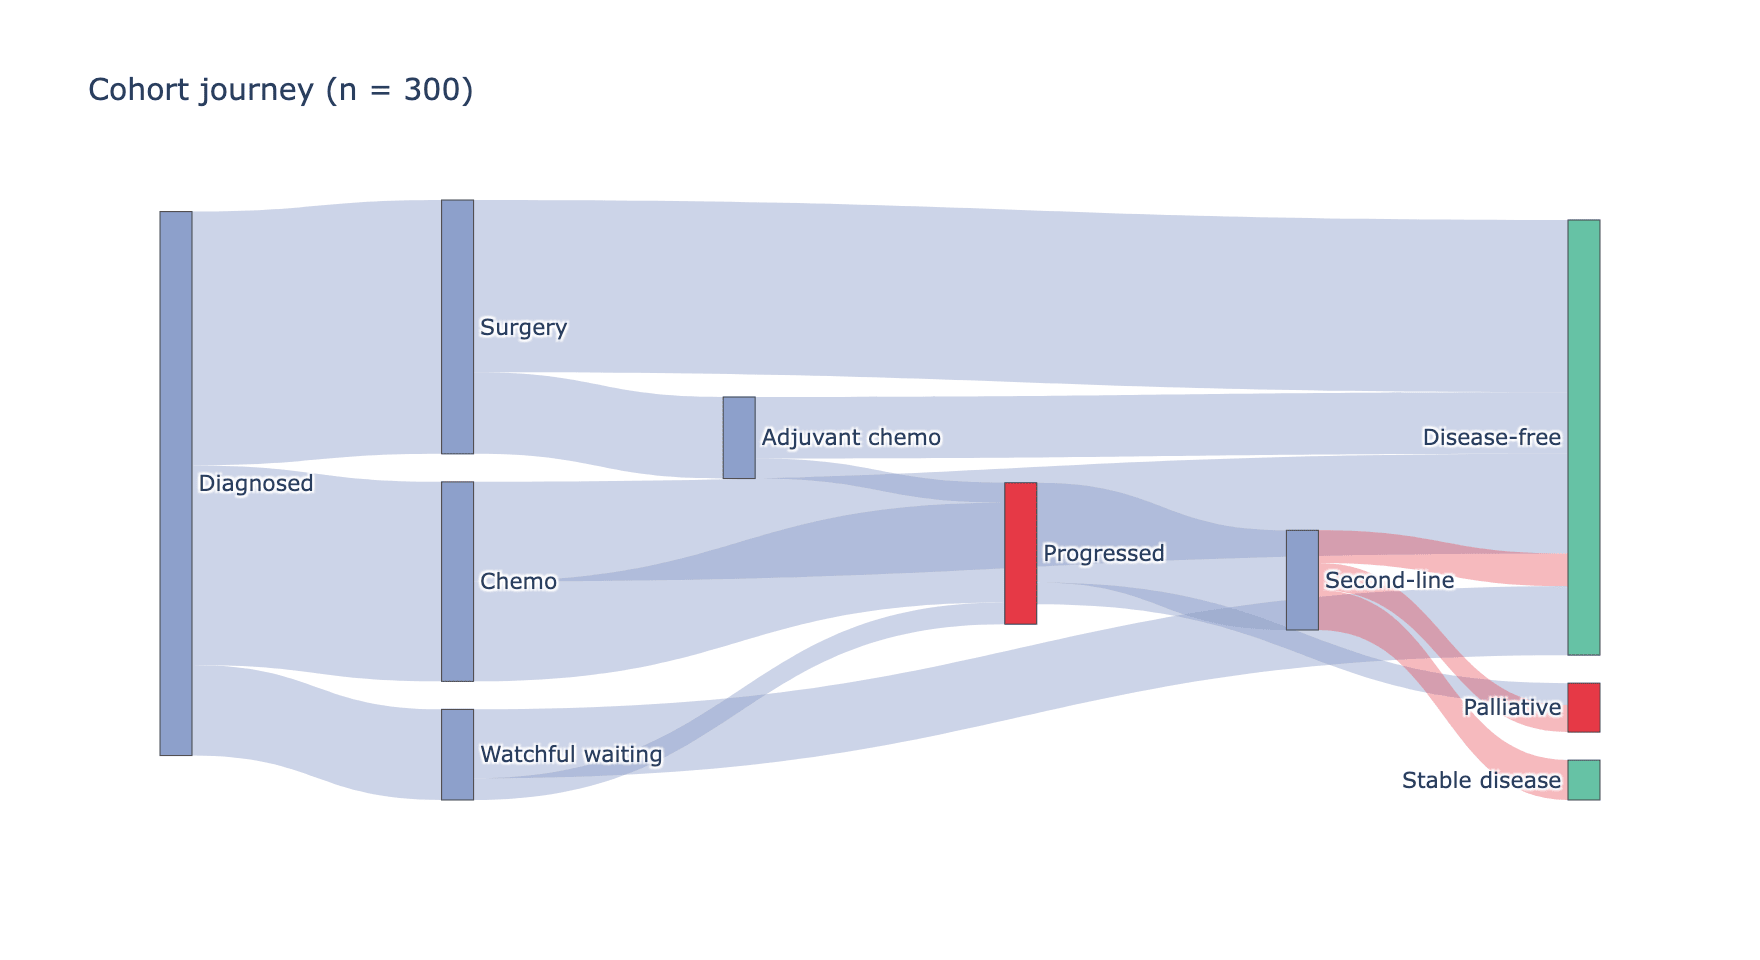
桑基图用宽度正比于流量的弧带在分阶段节点间路由流量——是患者旅程(筛查 → 治疗 → 结局)、细胞类型转换或测序通量分配的自然展示。matplotlib 没有可用的桑基实现;plotly 的 go.Sankey 处理节点布局与交互悬停,quarto 可将结果嵌入独立 HTML。
示例
环境配置
- 系统要求:跨平台(Linux/MacOS/Windows)
- 编程语言:Python
- 依赖包:
pandas、numpy、plotly
数据准备
我们把临床队列旅程汇总为节点到节点的流量:300 名患者从确诊经两个治疗阶段到结局。流量是(源,目标,数量)三元组。
flows = pd.DataFrame([
    # 阶段 1:确诊 -> 初始治疗
    ('Diagnosed', 'Surgery', 140),
    ('Diagnosed', 'Chemo', 110),
    ('Diagnosed', 'Watchful waiting', 50),
    # 阶段 2:初始治疗 -> 结局
    ('Surgery', 'Disease-free', 95),
    ('Surgery', 'Adjuvant chemo', 45),
    ('Chemo', 'Disease-free', 55),
    ('Chemo', 'Progressed', 55),
    ('Watchful waiting', 'Disease-free', 38),
    ('Watchful waiting', 'Progressed', 12),
    # 阶段 3:辅助/进展 -> 最终状态
    ('Adjuvant chemo', 'Disease-free', 34),
    ('Adjuvant chemo', 'Progressed', 11),
    ('Progressed', 'Second-line', 55),
    ('Progressed', 'Palliative', 12),
    ('Second-line', 'Disease-free', 18),
    ('Second-line', 'Stable disease', 22),
    ('Second-line', 'Palliative', 15),
], columns=['Source', 'Target', 'Value'])

nodes = list(dict.fromkeys(
    flows.Source.tolist() + flows.Target.tolist()))
node_index = {n: i for i, n in enumerate(nodes)}
node_colors = ['#8da0cb' if n in ('Diagnosed', 'Surgery', 'Chemo',
                                 'Watchful waiting', 'Adjuvant chemo',
                                 'Second-line')
               else '#66c2a5' if 'Disease-free' in n or 'Stable' in n
               else '#e63946'
               for n in nodes]
可视化
队列旅程桑基图
节点声明一次,之后每条流量按索引引用;给每条弧带分配其源节点颜色可保持阶段可读。
fig = go.Figure(data=[go.Sankey(
    node=dict(label=nodes, pad=14, thickness=16,
              color=node_colors),
    link=dict(
        source=[node_index[s] for s, _, _ in flows.itertuples(index=False)],
        target=[node_index[t] for _, t, _ in flows.itertuples(index=False)],
        value=flows.Value,
        color=['rgba(141,160,203,0.45)' if node_index[s] < 6
               else 'rgba(230,57,70,0.35)'
               for s, _, _ in flows.itertuples(index=False)],
    ))])
fig.update_layout(title_text='Cohort journey (n = 300)',
                  font_size=11, width=880, height=480)
fig.show()渲染结果是交互式的:悬停弧带显示确切患者数,悬停节点显示总入/出流量。
参考文献
- Plotly Technologies Inc. Sankey diagram in Python. https://plotly.com/python/sankey-diagram/
- Schmidt, M. The Sankey diagram in energy and material flow accounting. Journal of Industrial Ecology (2008).