import matplotlib.pyplot as plt
import seaborn as sns
import numpy as np
from sklearn.metrics import confusion_matrix混淆矩阵(Python)
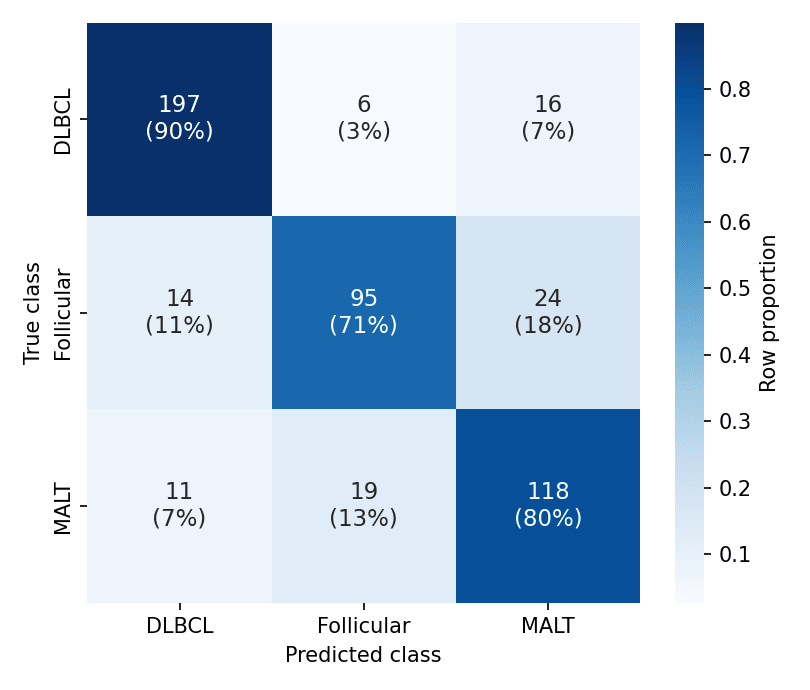
混淆矩阵把真实类别与预测类别交叉列表,暴露分类器犯错的方向——恶性误判为良性与良性误判为恶性的代价并不相等。按行归一化使各类别准确率在类别不平衡下可比;同时标注计数与占比让矩阵可审计。scikit-learn 计算,seaborn.heatmap 渲染。
示例
环境配置
- 系统要求:跨平台(Linux/MacOS/Windows)
- 编程语言:Python
- 依赖包:
matplotlib、seaborn、numpy、scikit-learn
数据准备
我们模拟三分类淋巴瘤分类器(500 个验证病例)的预测,并设置符合实际的混淆:滤泡性淋巴瘤误判为 MALT 淋巴瘤多于反向。
np.random.seed(171)

classes = ['DLBCL', 'Follicular', 'MALT']
truth = np.random.choice(classes, 500, p=[0.45, 0.30, 0.25])
pred = []
for t in truth:
    if t == 'DLBCL':
        pred.append(np.random.choice(classes, p=[0.90, 0.04, 0.06]))
    elif t == 'Follicular':
        pred.append(np.random.choice(classes, p=[0.08, 0.74, 0.18]))
    else:
        pred.append(np.random.choice(classes, p=[0.07, 0.10, 0.83]))
pred = np.array(pred)

cm = confusion_matrix(truth, pred, labels=classes)
cm_norm = cm / cm.sum(axis=1, keepdims=True)
可视化
计数矩阵
先看原始计数——所有下游指标都可由它重建。
fig, ax = plt.subplots(figsize=(5.2, 4.4))
sns.heatmap(cm, annot=True, fmt='d', cmap='Blues', cbar=False,
            xticklabels=classes, yticklabels=classes, ax=ax,
            annot_kws=dict(fontsize=13))
ax.set_xlabel('Predicted class')
ax.set_ylabel('True class')
ax.tick_params(axis='x', rotation=0)
plt.tight_layout()
plt.show()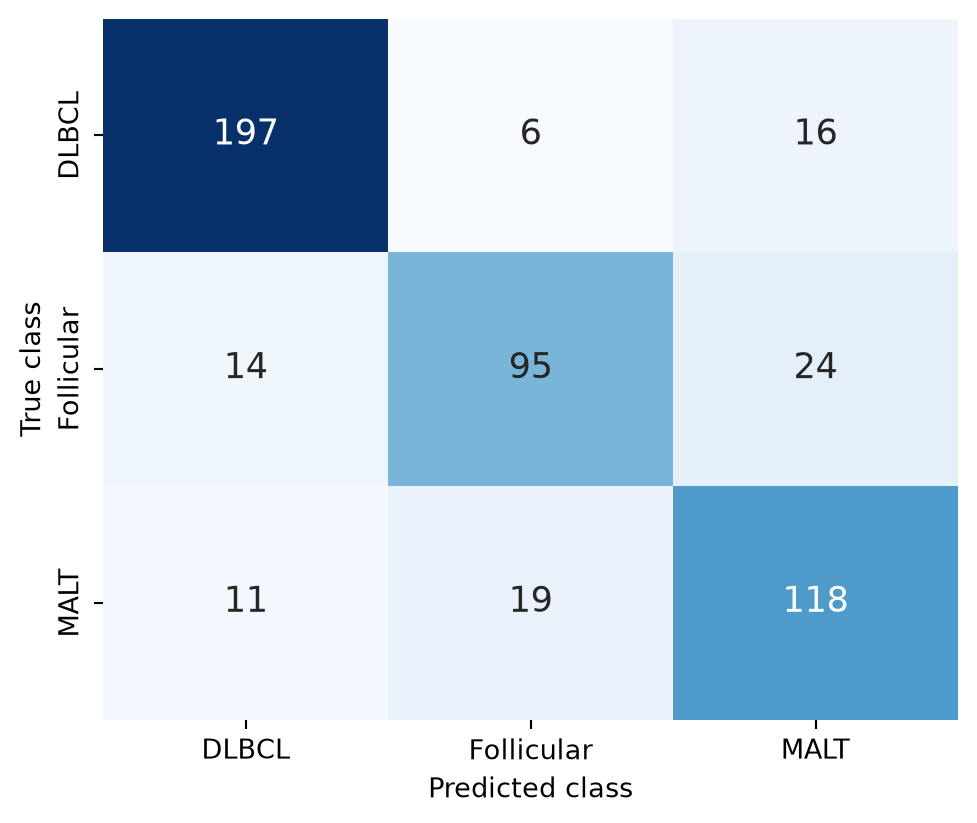
行归一化矩阵(双读数)
一种色标无法同时服务计数与占比;每格同时标注计数与行内占比,颜色则按归一化值编码。
fig, ax = plt.subplots(figsize=(5.4, 4.6))
labels = np.array([[f'{c}\n({s:.0%})' for c, s in zip(row_c, row_n)]
                   for row_c, row_n in zip(cm, cm_norm)])
sns.heatmap(cm_norm, annot=labels, fmt='', cmap='Blues', cbar=True,
            cbar_kws=dict(label='Row proportion'),
            xticklabels=classes, yticklabels=classes, ax=ax,
            annot_kws=dict(fontsize=11))
ax.set_xlabel('Predicted class')
ax.set_ylabel('True class')
ax.tick_params(axis='x', rotation=0)
plt.tight_layout()
plt.show()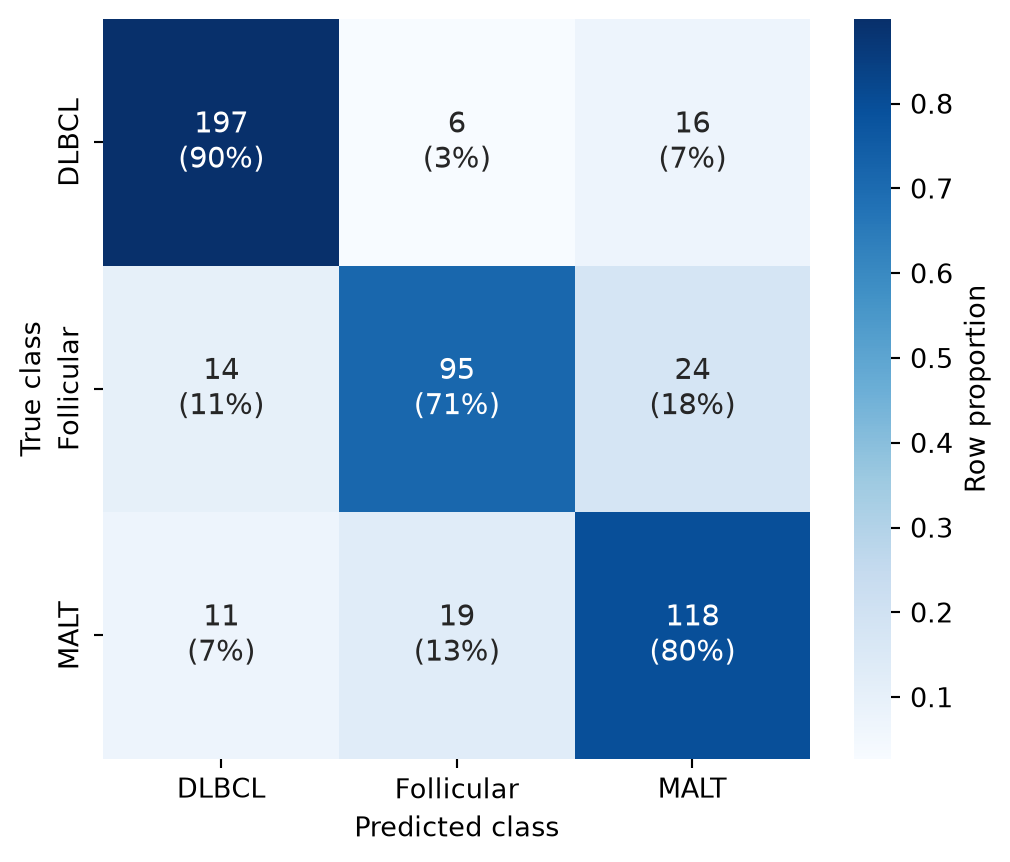
参考文献
- Pedregosa, F., et al. (2011). Scikit-learn: Machine Learning in Python. Journal of Machine Learning Research, 12, 2825-2830.
- Waskom, M. L. (2021). seaborn: statistical data visualization. Journal of Open Source Software, 6(60), 3021.