import matplotlib.pyplot as plt
import seaborn as sns
import pandas as pd
import numpy as np箱线图(Python)
箱线图通过中位数、四分位数和离群值概括数值型变量的分布。在生物医学研究中,箱线图是比较不同基因型、批次或处理组之间生物标志物水平的标准紧凑展示方式。Python 的 seaborn 构建在 matplotlib 之上,提供缺口(notch)、分组和散点叠加等多种出版级变体。
示例
环境配置
- 系统要求:跨平台(Linux/MacOS/Windows)
- 编程语言:Python
- 依赖包:
matplotlib、seaborn、pandas、numpy
数据准备
我们模拟三种基因型(WT、HET、KO)的血清生物标志物检测数据,并为分组变体加入性别因素;每个基因型 60 个重复以保证四分位数估计的稳定性。
np.random.seed(7)

genotypes = ['WT', 'HET', 'KO']
n_per_genotype = 60
df = pd.DataFrame({
    'Genotype': np.repeat(genotypes, n_per_genotype),
    'Sex': np.tile(np.repeat(['Female', 'Male'], n_per_genotype // 2), 3),
    'Biomarker': np.concatenate([
        np.random.lognormal(1.2, 0.45, n_per_genotype),
        np.random.lognormal(1.55, 0.45, n_per_genotype),
        np.random.lognormal(1.95, 0.55, n_per_genotype),
    ])
})
# 在 KO 组注入若干极端值,用于演示离群值展示
df.loc[df.index[-3:], 'Biomarker'] *= 3.5
可视化
基础箱线图
箱体跨越四分位距(IQR),中线为中位数,须线延伸至 1.5 × IQR;超出该范围的点以离群值(fliers)绘制。
plt.figure(figsize=(5.5, 4.2))
ax = sns.boxplot(data=df, x='Genotype', y='Biomarker',
                 color='#8da0cb', width=0.5, linewidth=1.0,
                 fliersize=3, flierprops=dict(markerfacecolor='0.4'))
ax.set_xlabel('Genotype')
ax.set_ylabel('Biomarker level (ng/mL)')
ax.spines[['top', 'right']].set_visible(False)
plt.tight_layout()
plt.show()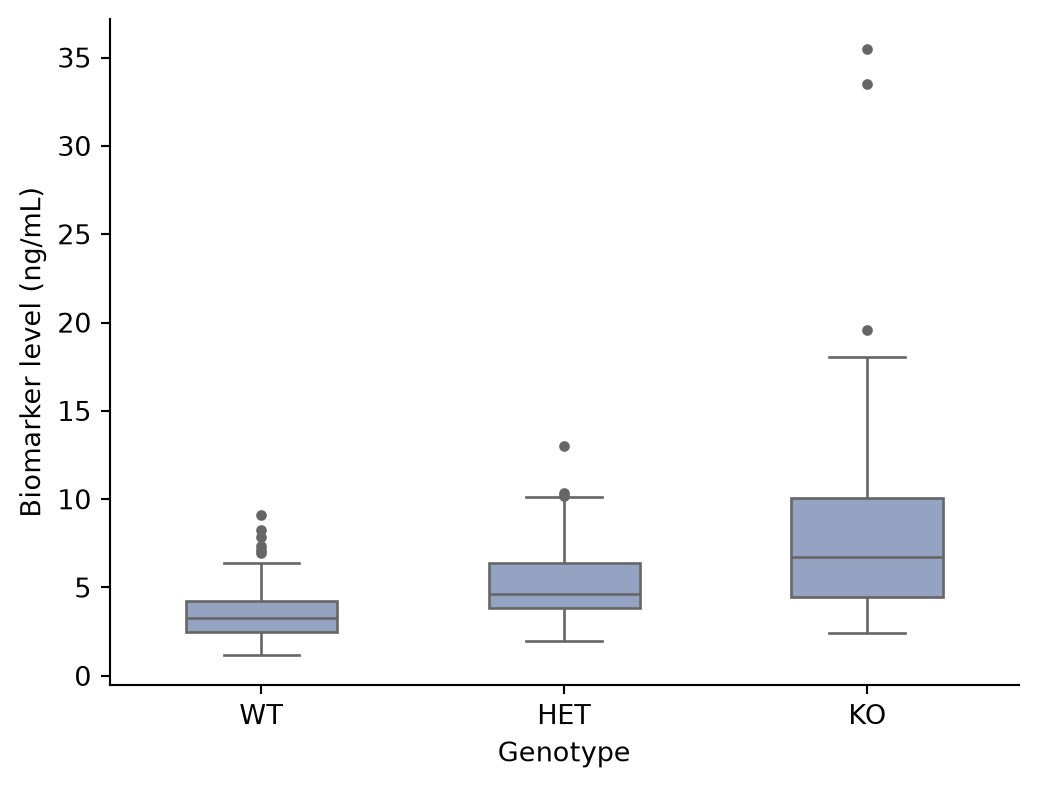
箱线图叠加散点
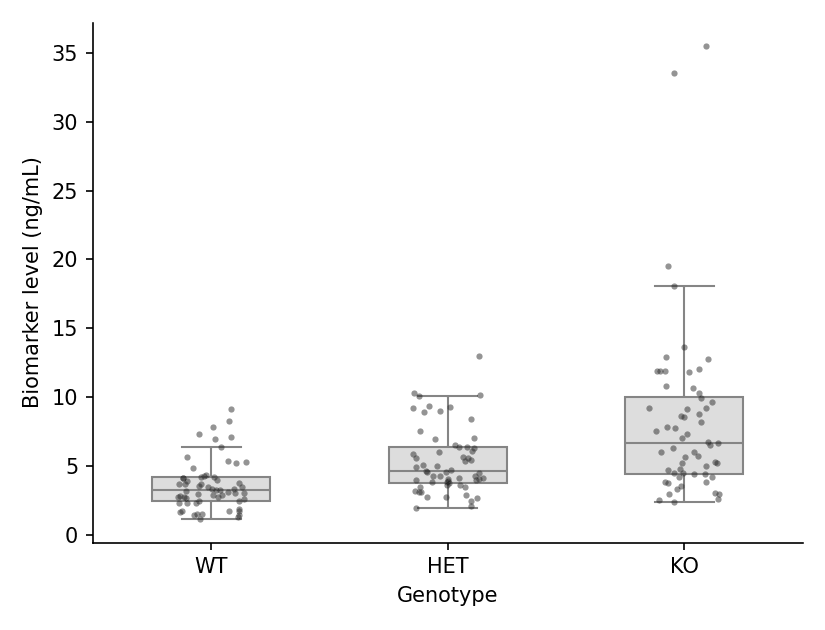
由于箱体会隐藏原始数据,叠加单个观测值是出版界推荐的风格:设置 showfliers=False 并添加一层 stripplot。
plt.figure(figsize=(5.5, 4.2))
ax = sns.boxplot(data=df, x='Genotype', y='Biomarker',
                 color='#dddddd', width=0.5, linewidth=1.0,
                 showfliers=False)
sns.stripplot(data=df, x='Genotype', y='Biomarker',
              color='#2b2b2b', size=3, alpha=0.5, jitter=0.15, ax=ax)
ax.set_xlabel('Genotype')
ax.set_ylabel('Biomarker level (ng/mL)')
ax.spines[['top', 'right']].set_visible(False)
plt.tight_layout()
plt.show()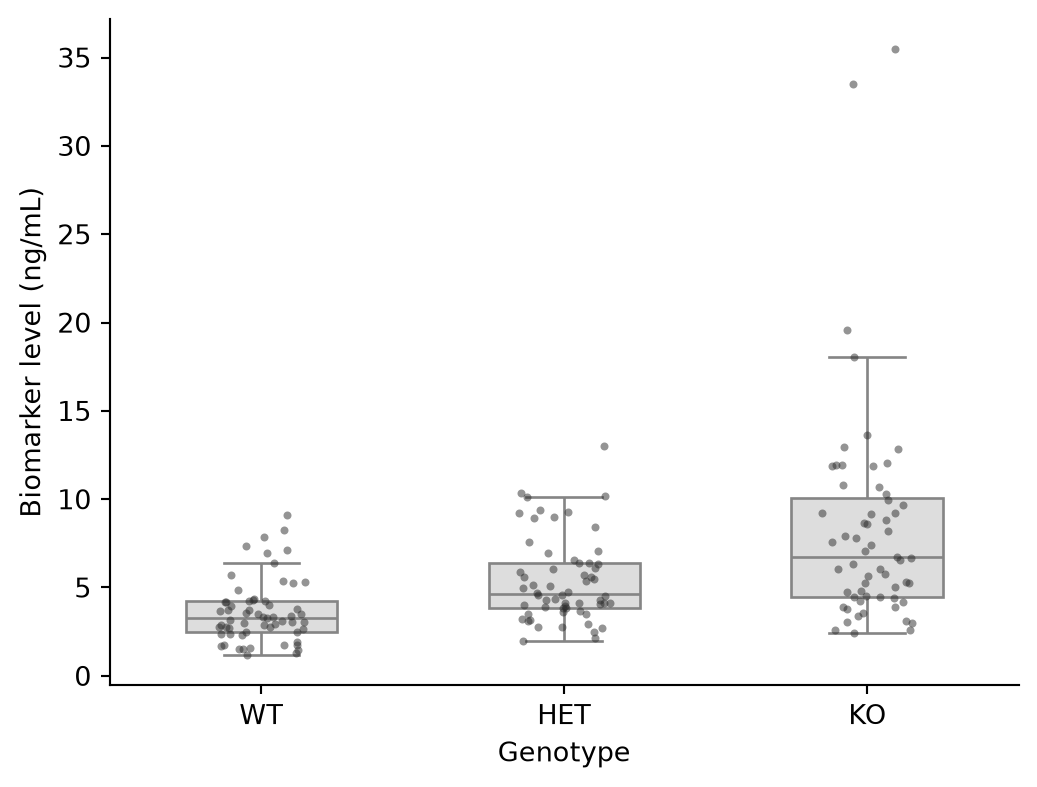
分组箱线图
第二个因素映射到 hue,在每个类别内生成成对的箱体——典型的配对或双队列比较形式。
plt.figure(figsize=(6.5, 4.2))
ax = sns.boxplot(data=df, x='Genotype', y='Biomarker', hue='Sex',
                 palette={'Female': '#e78ac3', 'Male': '#8da0cb'},
                 width=0.6, linewidth=1.0, fliersize=2.5)
ax.set_xlabel('Genotype')
ax.set_ylabel('Biomarker level (ng/mL)')
ax.legend(frameon=False, title=None)
ax.spines[['top', 'right']].set_visible(False)
plt.tight_layout()
plt.show()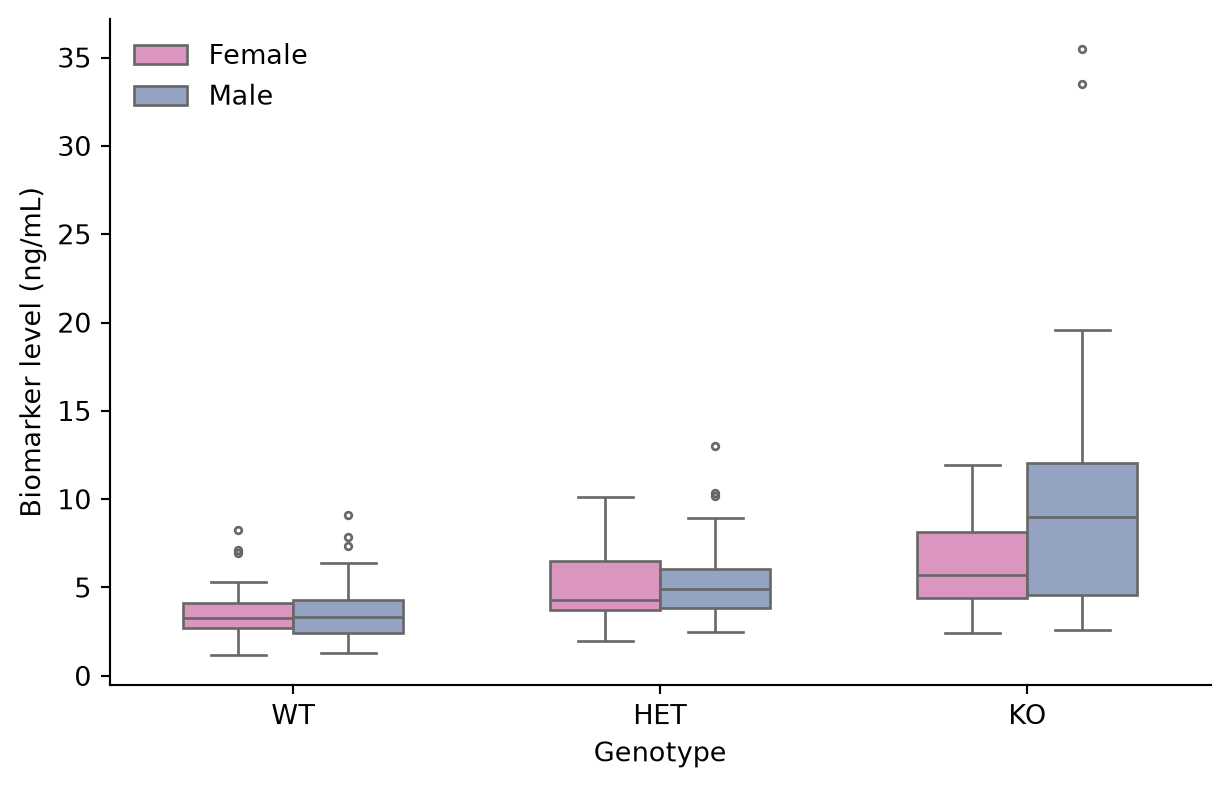
缺口箱线图
缺口近似中位数的 95% 置信区间;两个箱体之间的缺口不重叠可作为中位数存在差异的非正式证据。
plt.figure(figsize=(5.5, 4.2))
ax = sns.boxplot(data=df, x='Genotype', y='Biomarker',
                 color='#a6d854', width=0.5, linewidth=1.0,
                 notch=True, fliersize=3)
ax.set_xlabel('Genotype')
ax.set_ylabel('Biomarker level (ng/mL)')
ax.spines[['top', 'right']].set_visible(False)
plt.tight_layout()
plt.show()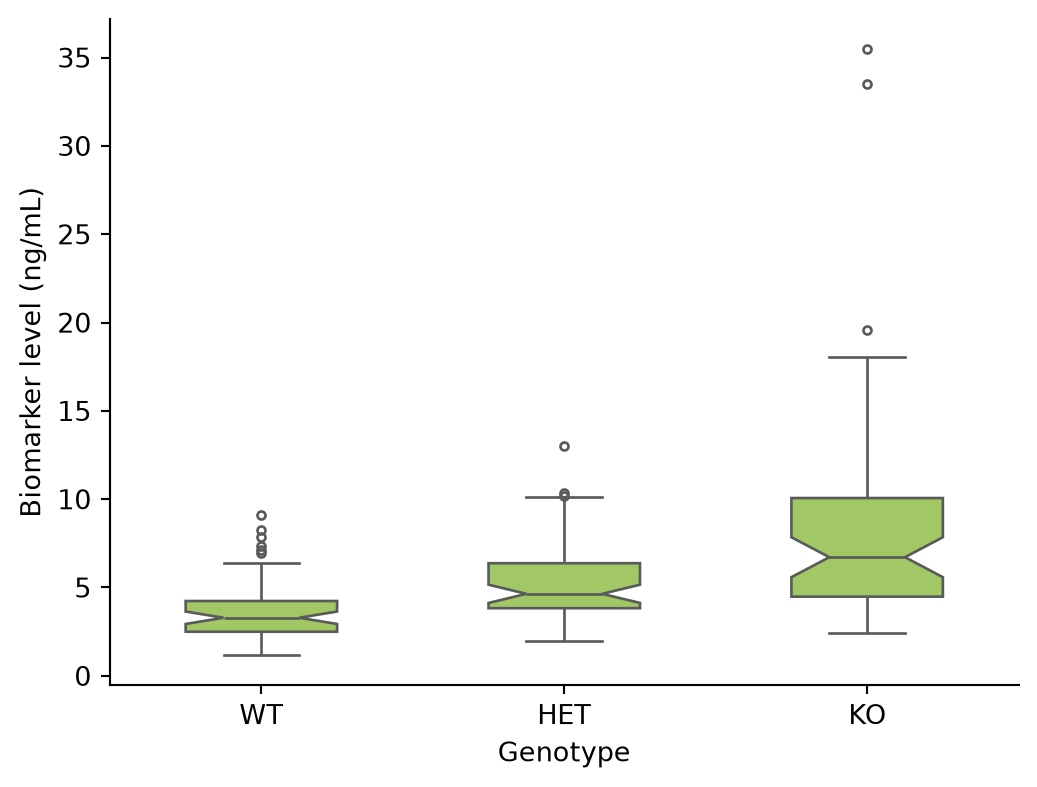
参考文献
- Hunter, J. D. (2007). Matplotlib: A 2D graphics environment. Computing in Science & Engineering, 9(3), 90-95.
- Waskom, M. L. (2021). seaborn: statistical data visualization. Journal of Open Source Software, 6(60), 3021.
- Spitzer, M., Wildenhain, J., Rappsilber, J., & Tyers, M. (2014). BoxPlotR: a web tool for generation of box plots. Nature Methods, 11(2), 121-122.