if (!requireNamespace("ggplot2", quietly = TRUE)) install.packages("ggplot2")
if (!requireNamespace("ggrepel", quietly = TRUE)) install.packages("ggrepel")
if (!requireNamespace("dplyr", quietly = TRUE)) install.packages("dplyr")

library(ggplot2)
library(ggrepel)
library(dplyr)象限散点图
象限(或九宫格)散点图展示同一组特征的两种测量值,叠加象限阈值线,并用 ggrepel 标签突出显示感兴趣的命名特征 [1]。它是多组学一致性(RNA vs 蛋白、RNA vs ATAC)或展示基因处于生物学有意义区域(上调/上调、上调/下调等)的标准图。
Example
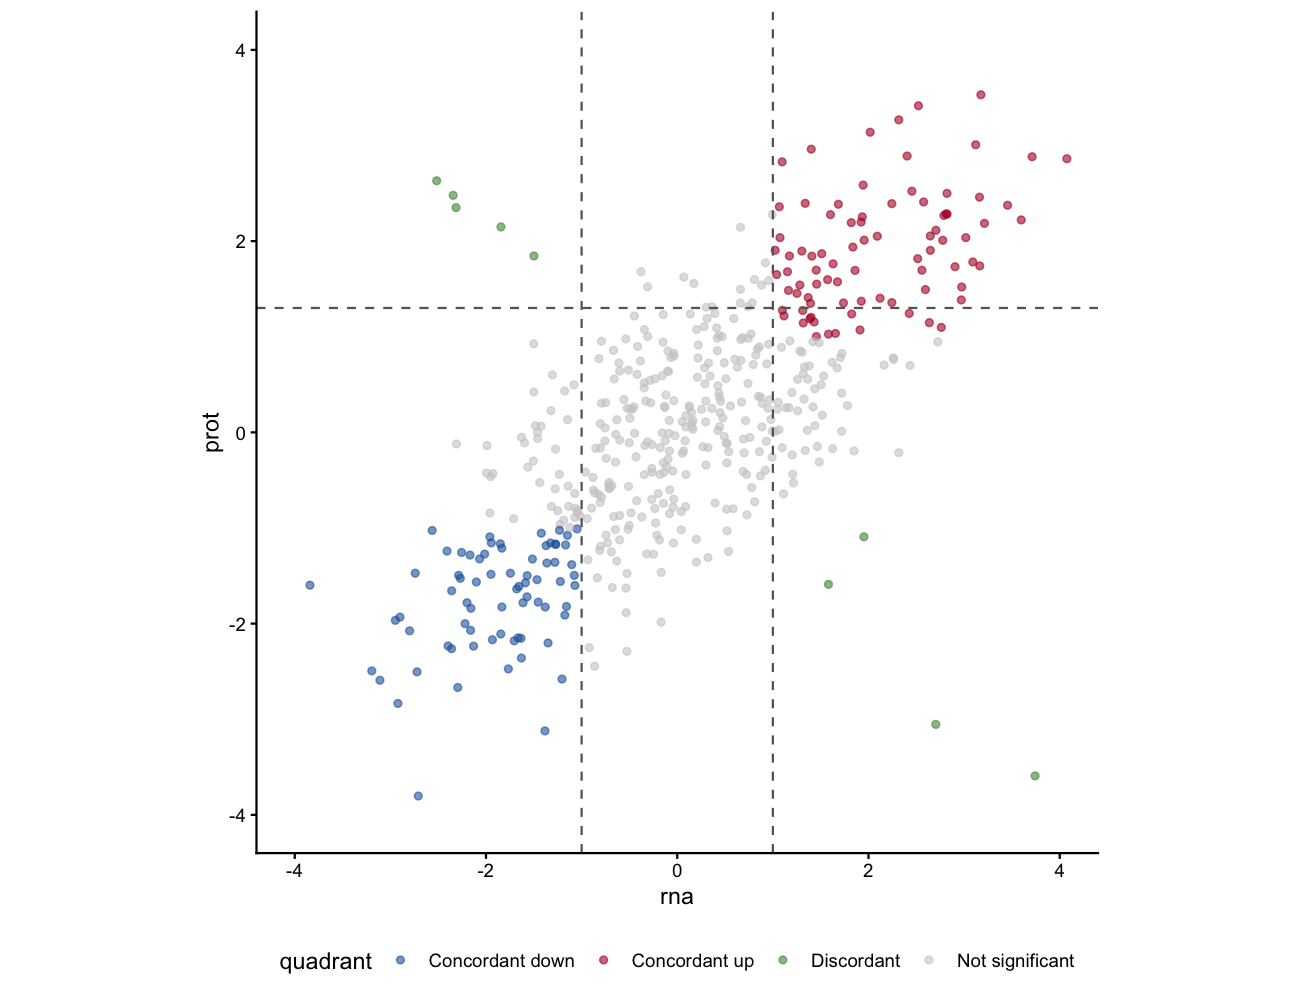
Setup
系统要求:跨平台(Linux/MacOS/Windows)
编程语言:R
依赖包:
ggplot2;ggrepel;dplyr
sessioninfo::session_info("attached")─ Session info ───────────────────────────────────────────────────────────────
setting value
version R version 4.6.2 (2026-10-29)
os Ubuntu 26.04.1 LTS
system x86_64, linux-gnu
ui X11
language (EN)
collate C.UTF-8
ctype C.UTF-8
tz UTC
date 2026-11-05
pandoc 3.7.0.2 @ /usr/bin/ (via rmarkdown)
quarto 1.11.9 @ /usr/local/bin/quarto
─ Packages ───────────────────────────────────────────────────────────────────
! package * version date (UTC) lib source
P dplyr * 1.2.1 2026-04-03 [?] RSPM
P ggplot2 * 4.0.3.9000 2026-11-03 [?] Github (tidyverse/ggplot2@b638d65)
P ggrepel * 0.9.8 2026-03-17 [?] RSPM
[1] /home/runner/.cache/R/renv/library/Bizard-5140bdc6/linux-ubuntu-resolute/R-4.6/x86_64-pc-linux-gnu
[2] /home/runner/work/_temp/Library
[3] /opt/R/4.6.2/lib/R/library
* ── Packages attached to the search path.
P ── Loaded and on-disk path mismatch.
──────────────────────────────────────────────────────────────────────────────Data Preparation
模拟 500 个基因的 RNA-seq 和蛋白质组学 log2 倍数变化,包含一致和不一致的基因子集,以及命名的高亮基因。
set.seed(2101)
n <- 500
genes <- paste0("Gene", sprintf("%04d", 1:n))
rna <- rnorm(n, sd = 1.5)
prot <- rna * 0.7 + rnorm(n, sd = 0.8)
# make a few discordant genes
disc <- sample(1:n, 15)
prot[disc] <- -rna[disc] + rnorm(15, sd = 0.3)
df_q <- data.frame(gene = genes, rna = rna, prot = prot)

# genes to label
label_genes <- c("Gene0001", "Gene0002", "Gene0015", "Gene0020",
                 "Gene0005", "Gene0008", "Gene0003")
Visualization
1. 九宫格象限散点图 + 标签
threshold <- 1
ggplot(df_q, aes(rna, prot)) +
  geom_point(alpha = 0.4, size = 1.5, colour = "grey50") +
  geom_vline(xintercept = c(-threshold, threshold), linetype = "dashed", colour = "grey40") +
  geom_hline(yintercept = c(-threshold, threshold), linetype = "dashed", colour = "grey40") +
  geom_point(data = subset(df_q, gene %in% label_genes),
             colour = "#B2182B", size = 2.5) +
  ggrepel::geom_text_repel(
    data = subset(df_q, gene %in% label_genes),
    aes(label = gene), size = 3, colour = "#B2182B",
    box.padding = 0.4, max.overlaps = 20) +
  coord_equal(xlim = c(-4, 4), ylim = c(-4, 4)) +
  labs(x = "RNA-seq log2FC", y = "Proteomics log2FC",
       title = "RNA vs protein concordance") +
  theme_classic(base_size = 11)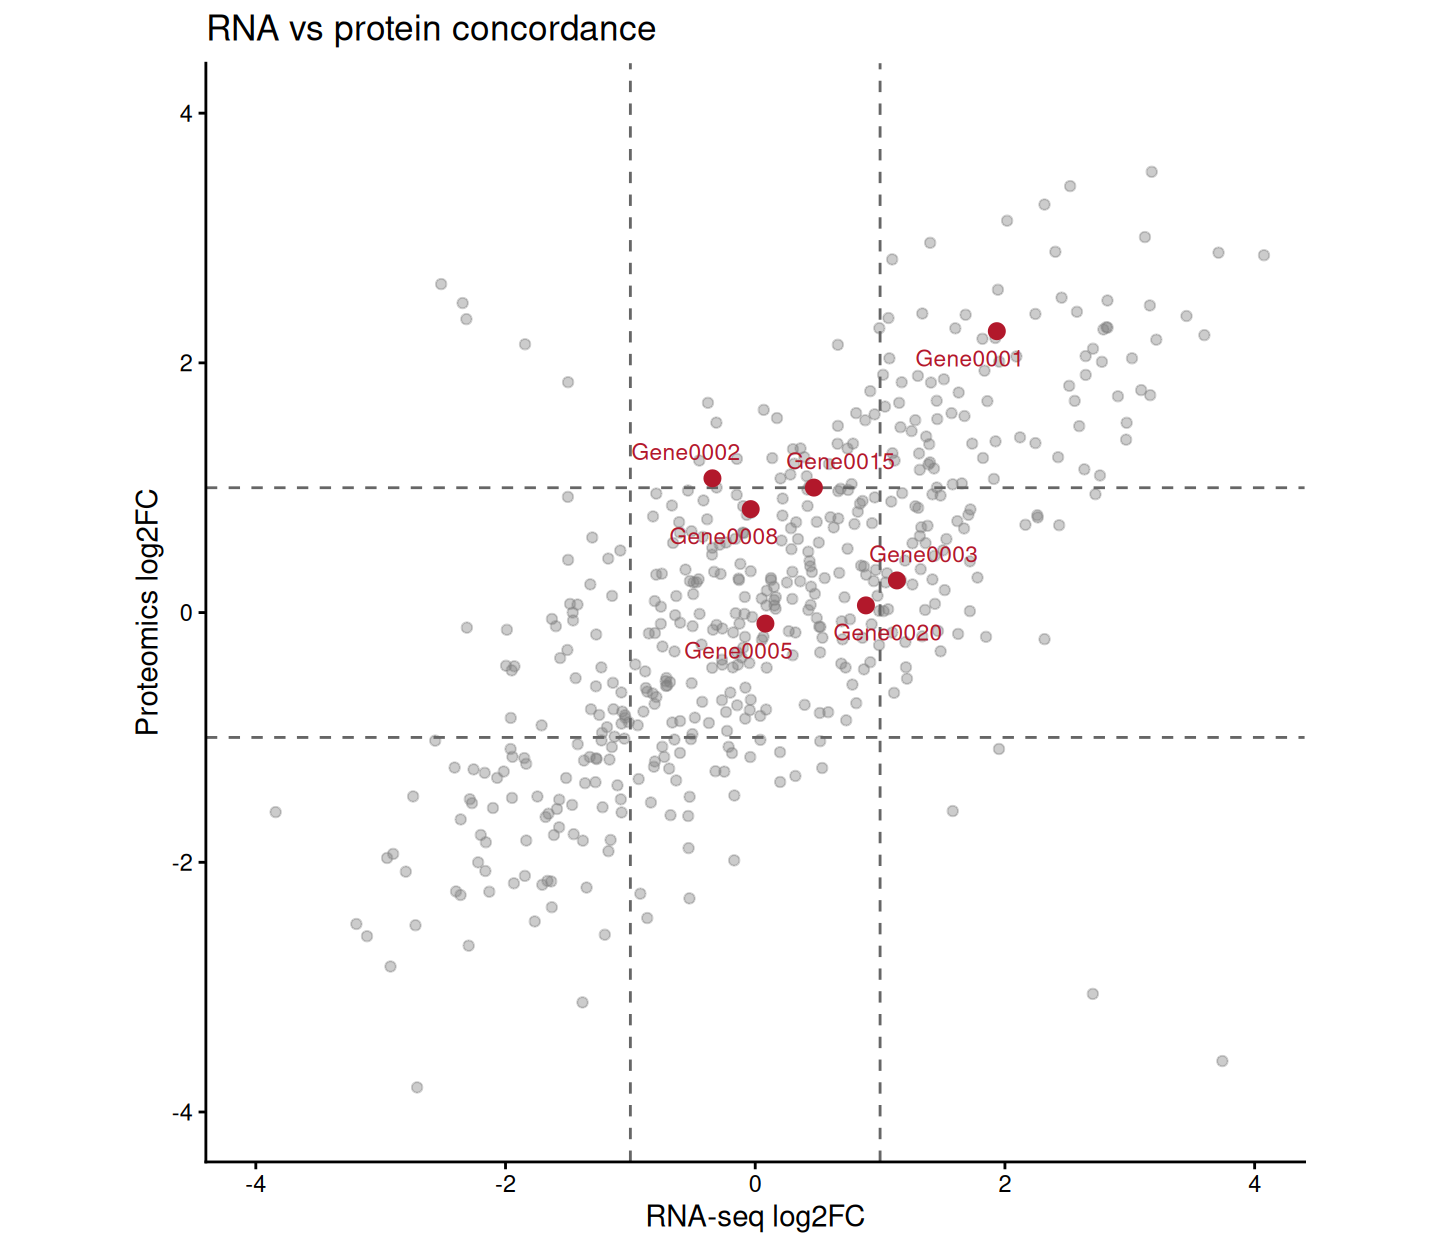
2. 着色象限区域
df_q <- df_q |>
  mutate(quadrant = case_when(
    rna > threshold & prot > threshold ~ "Concordant up",
    rna < -threshold & prot < -threshold ~ "Concordant down",
    abs(rna) > threshold & abs(prot) > threshold ~ "Discordant",
    TRUE ~ "Not significant"))

quad_cols <- c("Concordant up" = "#B2182B", "Concordant down" = "#2166AC",
               "Discordant" = "#4D9342", "Not significant" = "grey80")

ggplot(df_q, aes(rna, prot, colour = quadrant)) +
  geom_point(size = 1.5, alpha = 0.6) +
  geom_vline(xintercept = c(-threshold, threshold), linetype = "dashed", colour = "grey40") +
  geom_hline(yintercept = c(-threshold, threshold), linetype = "dashed", colour = "grey40") +
  scale_colour_manual(values = quad_cols) +
  geom_point(data = subset(df_q, gene %in% label_genes),
             colour = "black", size = 2.5, shape = 21, fill = "gold") +
  ggrepel::geom_text_repel(
    data = subset(df_q, gene %in% label_genes),
    aes(label = gene), size = 3, colour = "black",
    box.padding = 0.4, max.overlaps = 20) +
  coord_equal(xlim = c(-4, 4), ylim = c(-4, 4)) +
  labs(x = "RNA-seq log2FC", y = "Proteomics log2FC", colour = "Quadrant") +
  theme_classic(base_size = 11) +
  theme(legend.position = "bottom")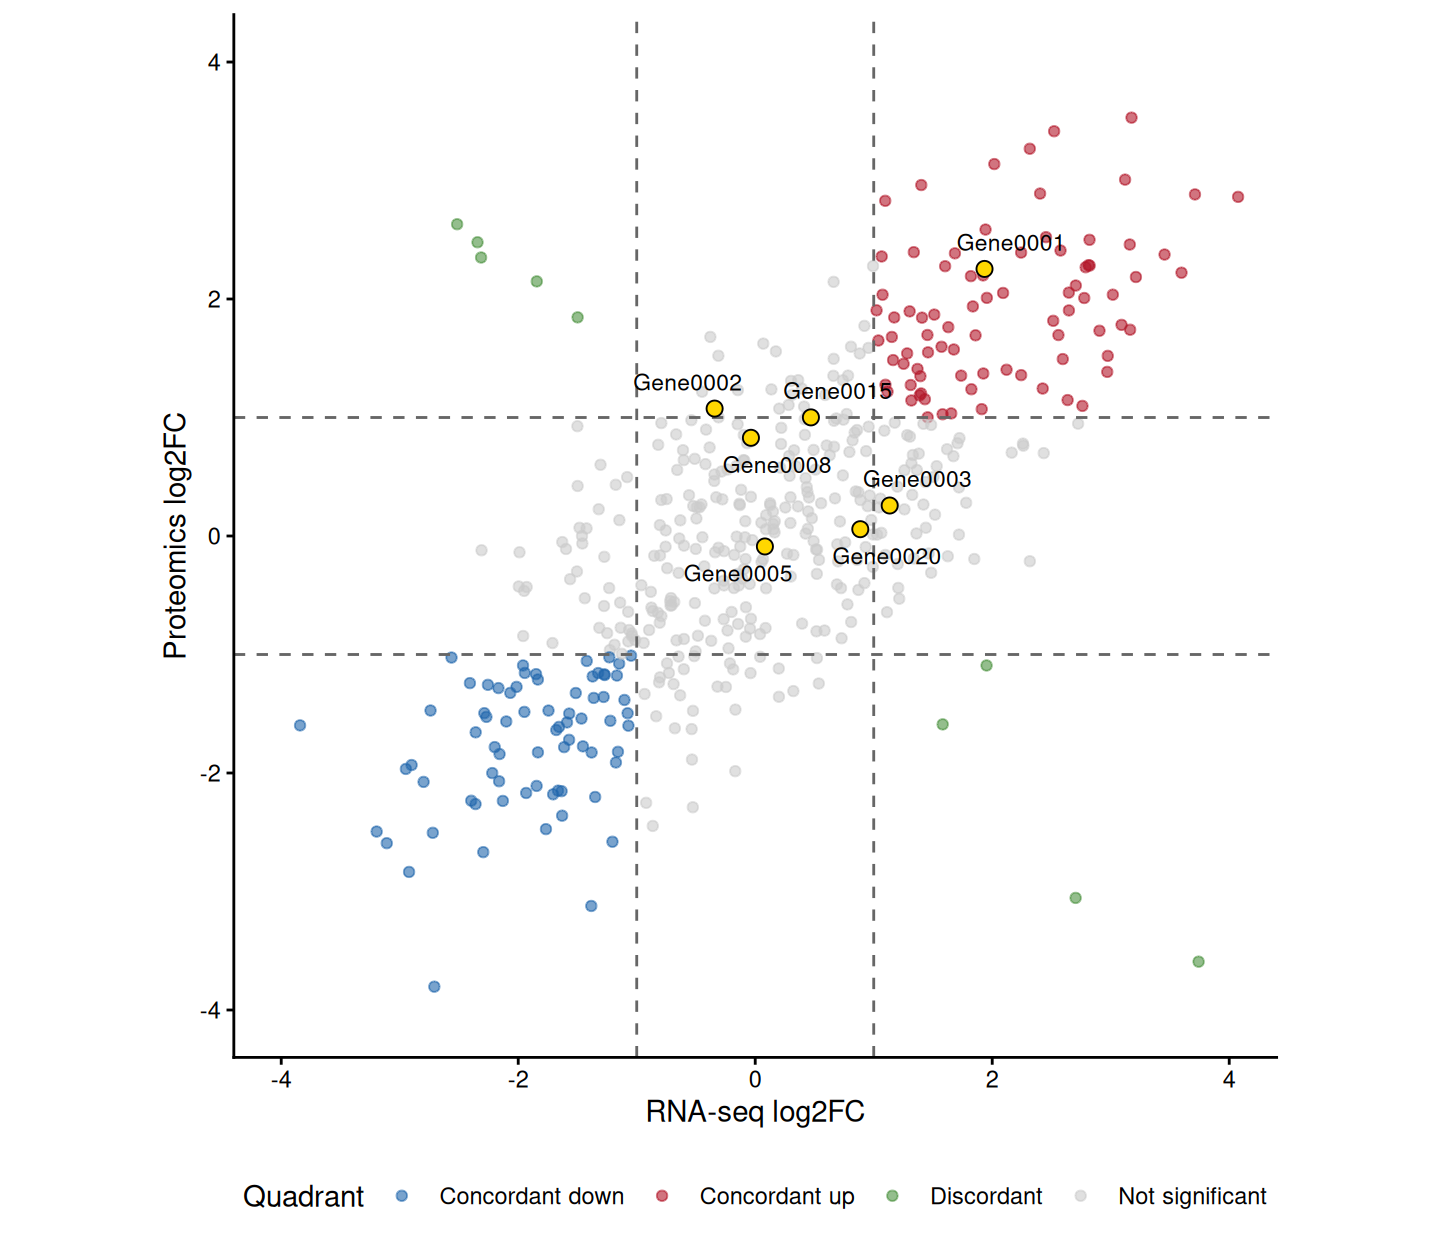
提示
Practice tips
- 调整
threshold以匹配数据的倍数变化截断值;默认 ±1 对应 |log2FC| > 1。 - 用
geom_text_repel()的max.overlaps = 20确保即使高亮基因很多标签也可读。 -
case_when()的象限分配可通过添加更多条件适配任意数量的区域。
Application
象限散点图是多组学一致性、药物反应筛选和 CRISPR 筛选比较的标准图。
Reference
[1] Xiaofan Lu, et al. FigureYa: A Standardized Visualization Framework for Enhancing Biomedical Data Interpretation and Research Efficiency. iMetaMed. 2025. doi:10.1002/imm3.70005