import matplotlib.pyplot as plt
from matplotlib_venn import venn2, venn3维恩图(Python)
维恩图以相互交叠的圆盘展示两到三个集合的交集,并在每个区域标注成员数。在生物医学研究中,它是药物靶点重叠、通路成员关系和队列交集的默认展示。matplotlib-venn 包根据集合大小计算区域面积并在 matplotlib 坐标轴上绘制。超过三个集合时,请改用 UpSet 图。
示例
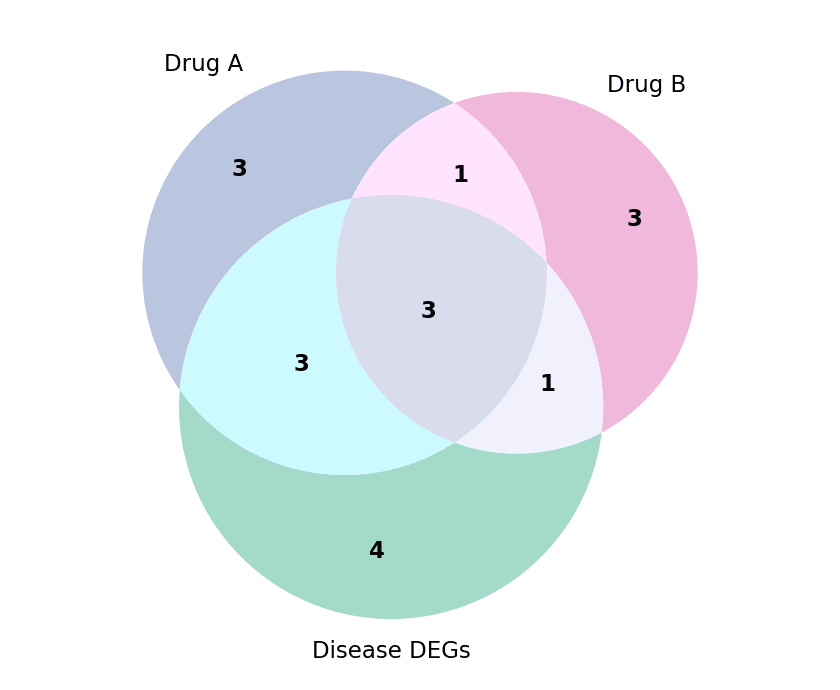
环境配置
- 系统要求:跨平台(Linux/MacOS/Windows)
- 编程语言:Python
- 依赖包:
matplotlib、matplotlib-venn
数据准备
我们比较三个基因列表:药物 A 靶点、药物 B 靶点,以及疾病队列的差异表达基因。
drug_a = {'EGFR', 'ERBB2', 'MET', 'ALK', 'ROS1', 'RET', 'NTRK1', 'BRAF', 'PIK3CA', 'MTOR'}
drug_b = {'ERBB2', 'EGFR', 'RET', 'KRAS', 'NRAS', 'MAP2K1', 'BRAF', 'PTEN'}
disease = {'EGFR', 'KRAS', 'TP53', 'BRAF', 'PIK3CA', 'APC', 'BRCA1', 'ERBB2', 'MET', 'ALK', 'RB1'}
可视化
两集合维恩图
venn2 可直接接受集合本身,也可接受 (ab, a, b) 的交集与独占计数元组;调整子集标签样式让数字更易读。
fig, ax = plt.subplots(figsize=(5, 4.2))
v = venn2([drug_a, drug_b], set_labels=('Drug A targets', 'Drug B targets'),
          set_colors=('#8da0cb', '#e78ac3'), alpha=0.65, ax=ax)
for pid in ('10', '01', '11'):
    if v.get_patch_by_id(pid):
        v.get_patch_by_id(pid).set_edgecolor('white')
        v.get_patch_by_id(pid).set_linewidth(1.5)
    lbl = v.get_label_by_id(pid)
    if lbl:
        lbl.set_fontsize(12)
        lbl.set_fontweight('bold')
ax.set_title(f'|A| = {len(drug_a)}   |B| = {len(drug_b)}', fontsize=10, color='0.35')
plt.tight_layout()
plt.show()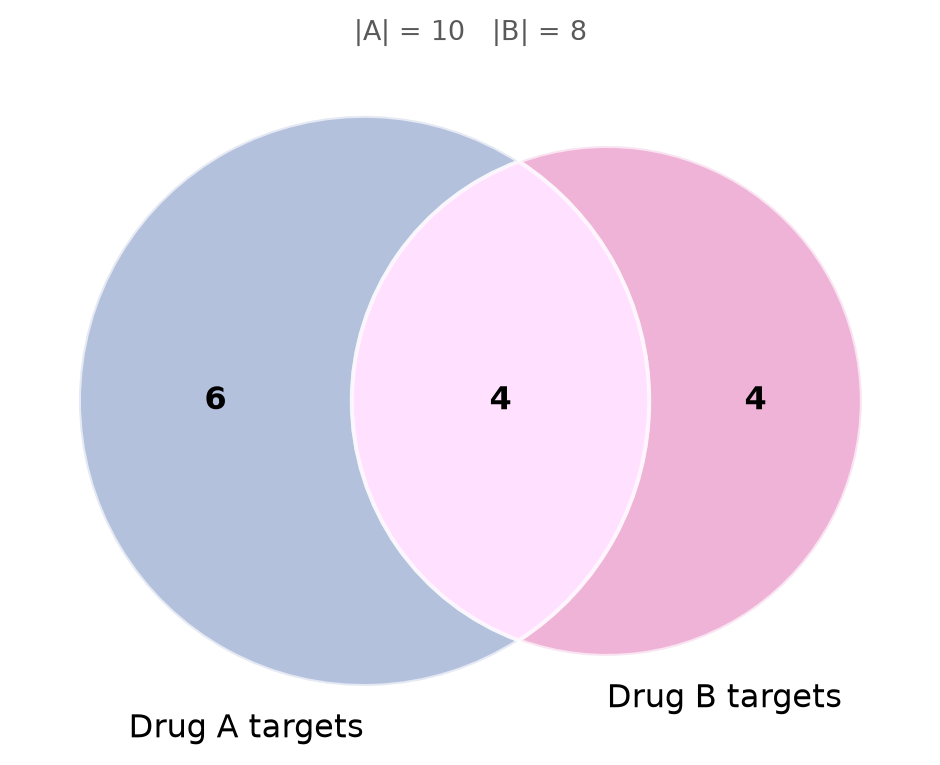
三集合维恩图
venn3 加入第三个圆盘与全部七个区域标签;每个集合着色一次并让透明度混合交集区域,可保持图面清晰。
fig, ax = plt.subplots(figsize=(5.6, 4.6))
v = venn3([drug_a, drug_b, disease],
          set_labels=('Drug A', 'Drug B', 'Disease DEGs'),
          set_colors=('#8da0cb', '#e78ac3', '#66c2a5'), alpha=0.6, ax=ax)
for pid in ('100', '010', '001', '110', '101', '011', '111'):
    lbl = v.get_label_by_id(pid)
    if lbl:
        lbl.set_fontsize(11)
        lbl.set_fontweight('bold')
for t in v.set_labels:
    if t:
        t.set_fontsize(11)
plt.tight_layout()
plt.show()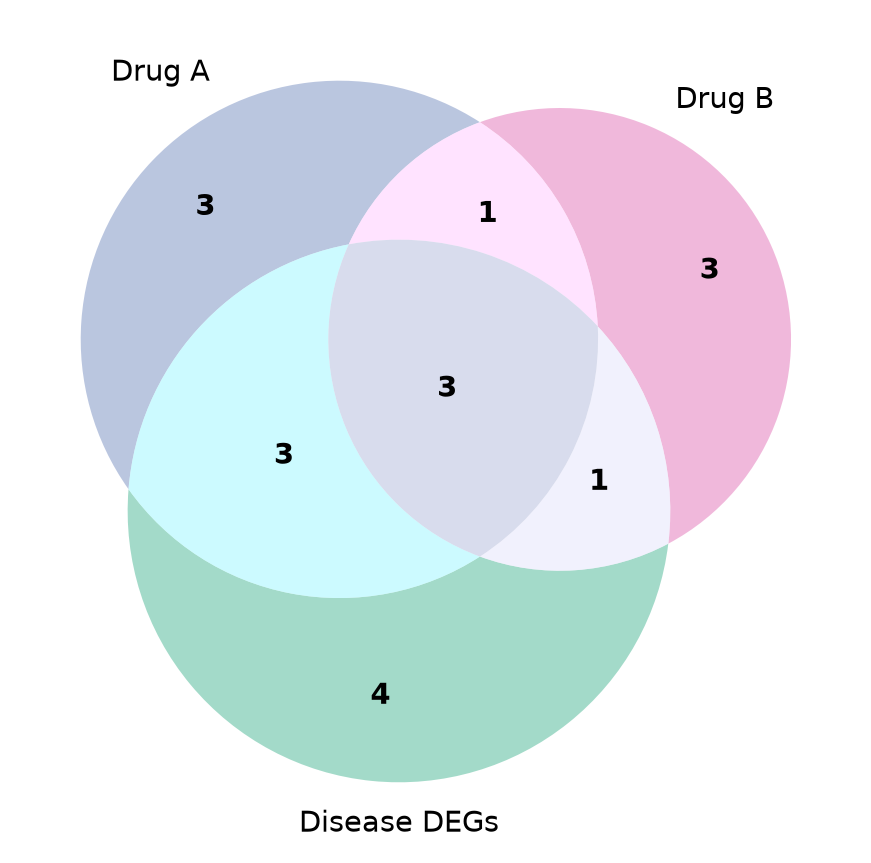
参考文献
- Konstantin Kudryavtsev. matplotlib-venn: Venn diagram plotting functions for matplotlib. https://github.com/konstantint/matplotlib-venn
- Hunter, J. D. (2007). Matplotlib: A 2D graphics environment. Computing in Science & Engineering, 9(3), 90-95.