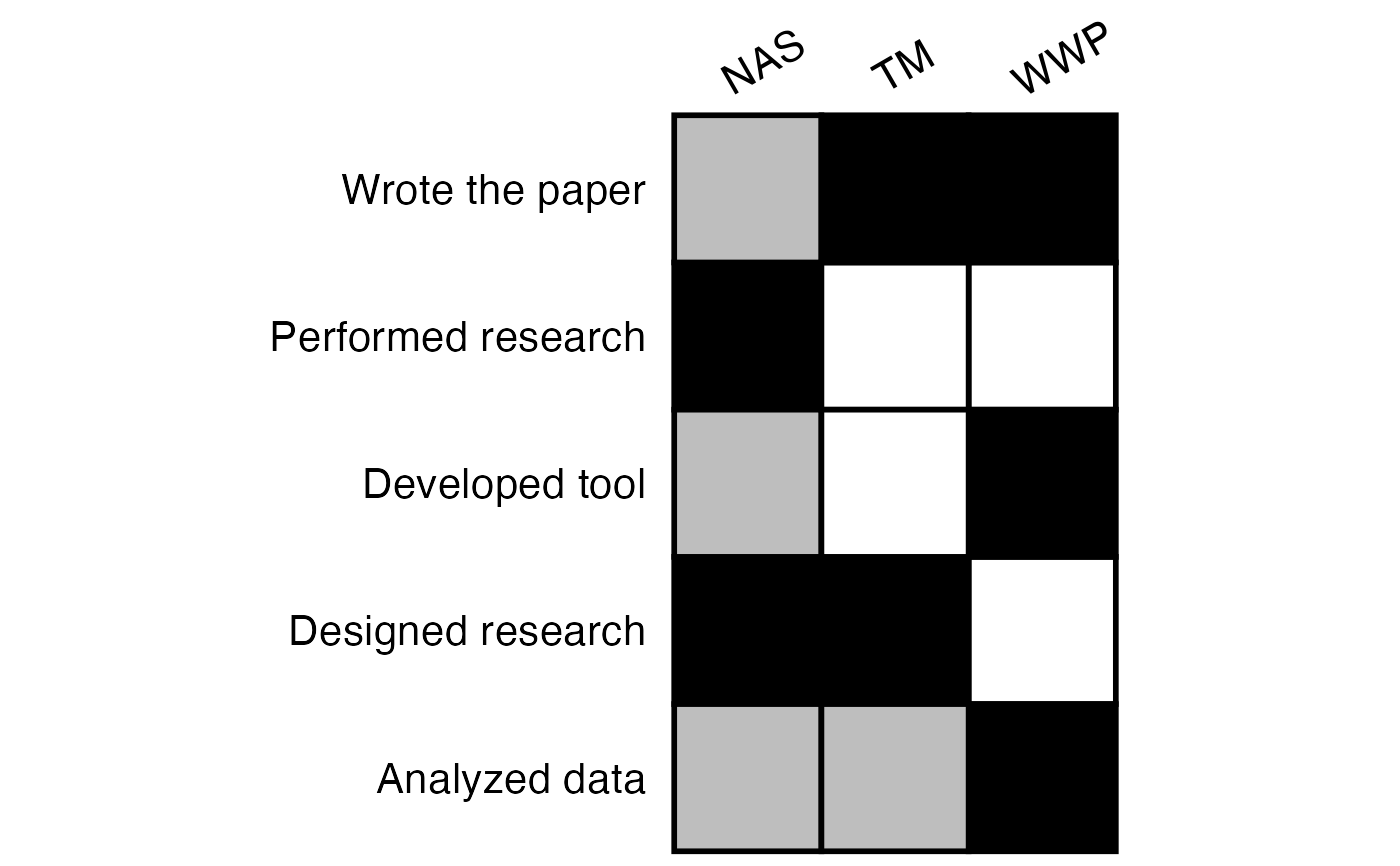
Generate contribution table
generate(
  data,
  color_map = c("white", "grey", "black"),
  palette_name = "github",
  sort = FALSE,
  show_legend = FALSE,
  title = NULL,
  xlab = NULL,
  ylab = NULL,
  caption = NULL,
  tag = NULL,
  font_size_x = 16,
  font_size_y = 16,
  text_angle_x = 30,
  text_angle_y = 0,
  hjust_x = 0.2,
  hjust_y = 1,
  vjust_x = 1,
  vjust_y = 0.5,
  coord_ratio = 1
)
Arguments
| data | a |
|---|---|
| color_map | color map for discrete order, either a length-3 vector for 3 contribution level:
None, Minor and Major; or a |
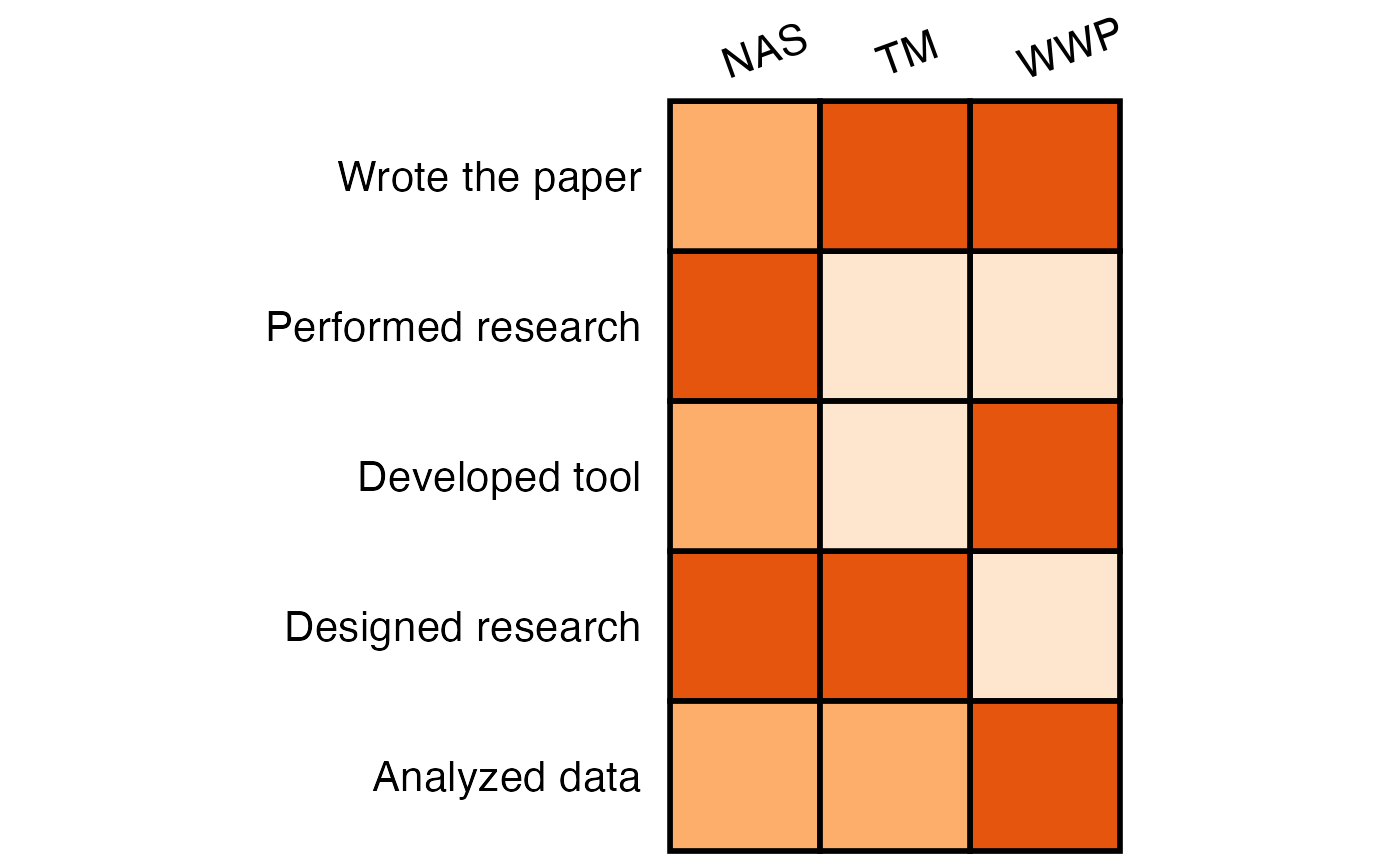
| palette_name | palette_name for plotting continuous contributions. See show_palette for available options. |
| sort | if |
| show_legend | if |
| title | The text for the title. |
| xlab | x axis label. |
| ylab | y axis label. |
| caption | The text for the caption which will be displayed in the bottom-right of the plot by default. |
| tag | The text for the tag label which will be displayed at the top-left of the plot by default. |
| font_size_x | font size for x. |
| font_size_y | font size for y. |
| text_angle_x | text angle for x. |
| text_angle_y | text angle for y. |
| hjust_x | hjust for x axis text. |
| hjust_y | hjust for y axis text. |
| vjust_x | vjust for x axis text. |
| vjust_y | vjust for y axis text. |
| coord_ratio | coordinate ratio. |
Value
a ggplot2 object
Examples
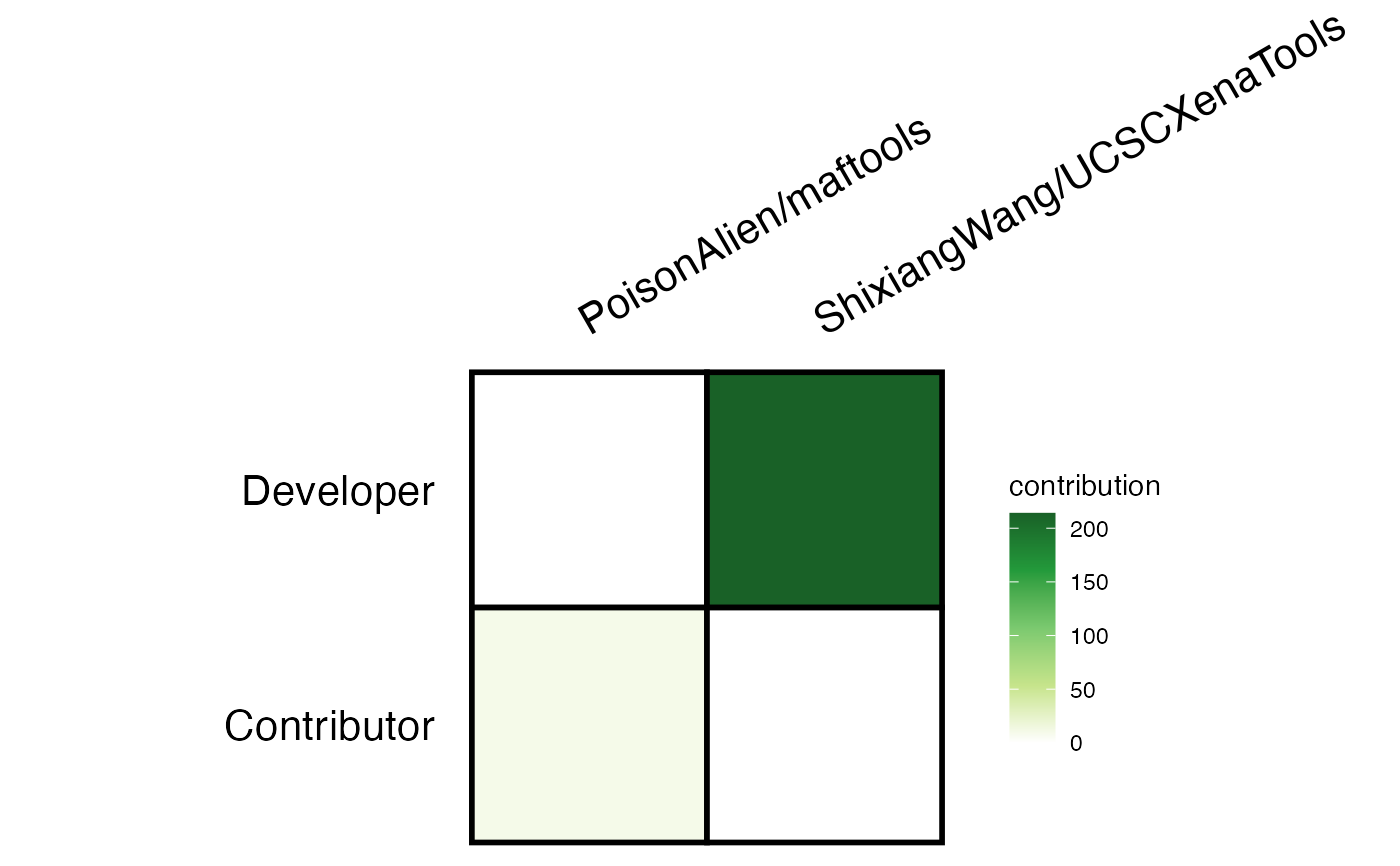
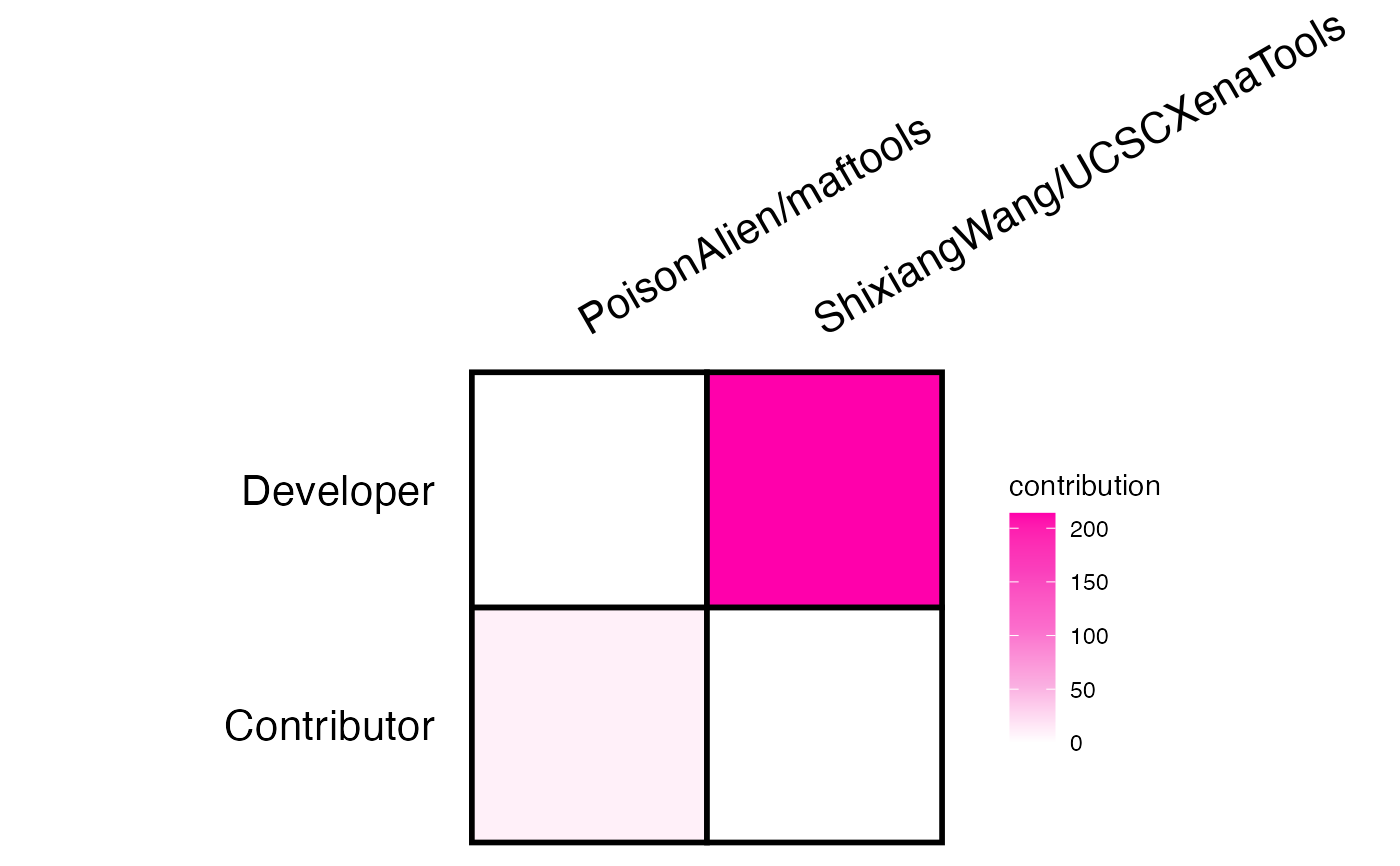
# \donttest{ # Github project contributions my_contr <- dplyr::tibble( repo = c("UCSCXenaTools", "maftools"), owner = c("ShixiangWang", "PoisonAlien"), username = "ShixiangWang", role = c("Developer", "Contributor") ) my_contr#> # A tibble: 2 x 4 #> repo owner username role #> <chr> <chr> <chr> <chr> #> 1 UCSCXenaTools ShixiangWang ShixiangWang Developer #> 2 maftools PoisonAlien ShixiangWang Contributor#> # A tibble: 2 x 3 #> role `PoisonAlien/maftools` `ShixiangWang/UCSCXenaTools` #> <chr> <int> <int> #> 1 Contributor 10 0 #> 2 Developer 0 214generate(contr_tb, show_legend = TRUE, hjust_x = 0)generate(contr_tb, show_legend = TRUE, hjust_x = 0, palette_name = "psychedelic" )# }